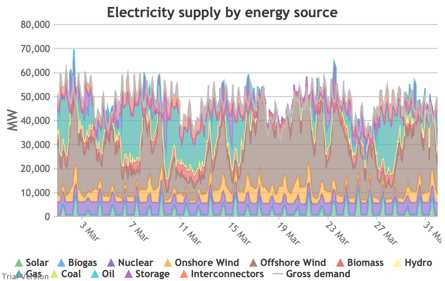
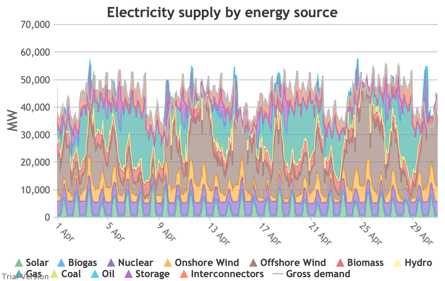
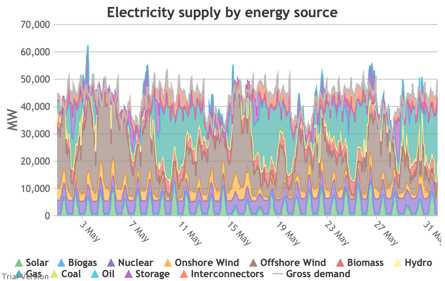
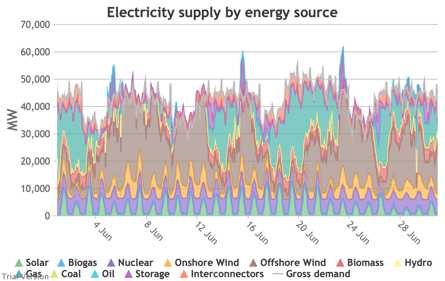
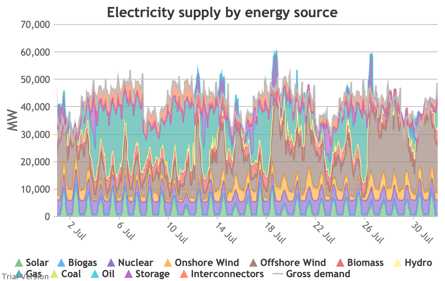
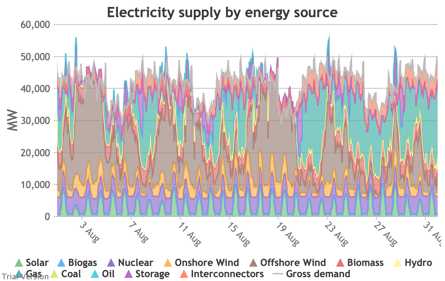
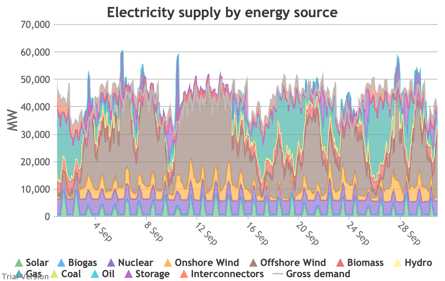
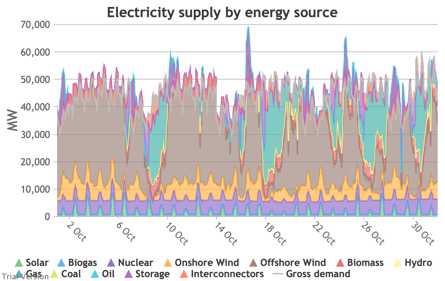
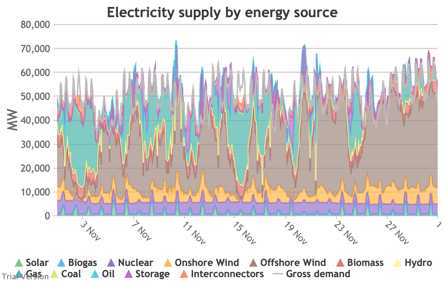
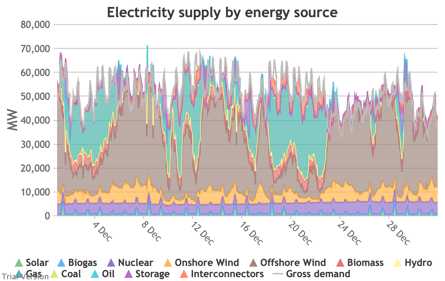
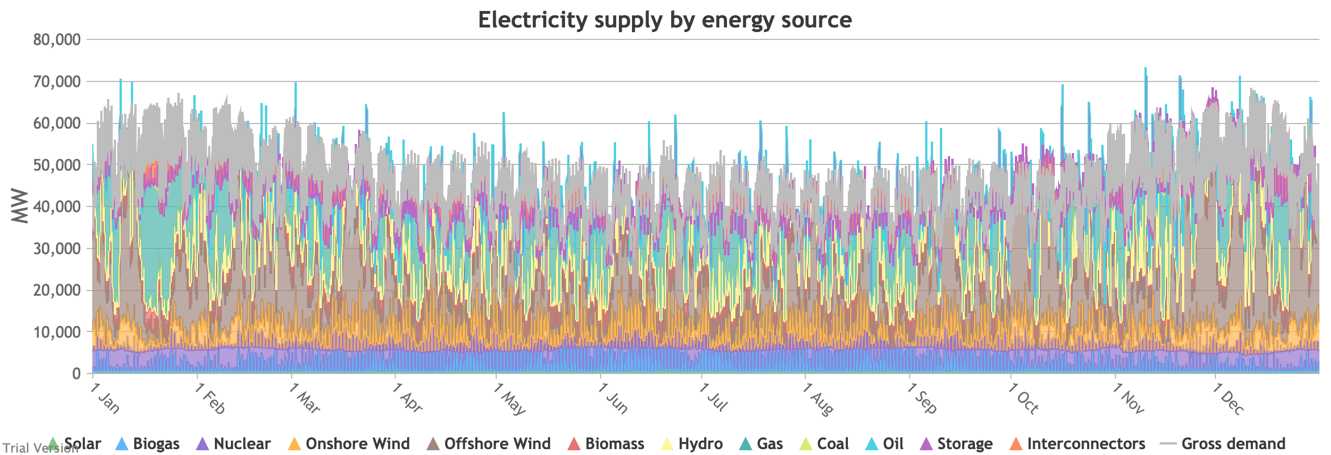
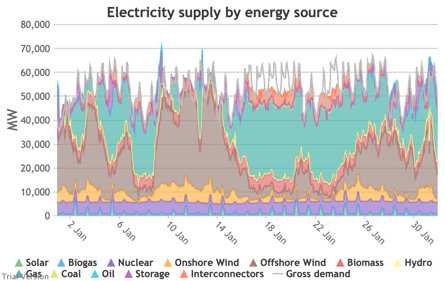
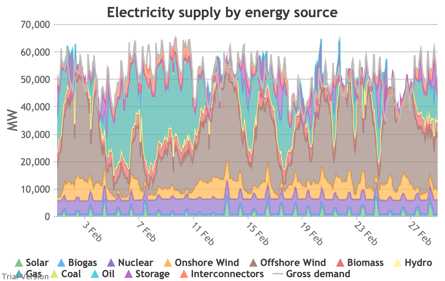
These charts show the same aggregate profiles as the previous section, but in this case divided by technology rather than grouped types of technology.

media embed 78ff6b38 5d88 45a8 94cf 013f0e8b3044
media embed debc806b 7a88 4b68 9fde b04ac3f2bdfd media embed 6ad7f9f3 8b69 4998 818e b285ff97d9a1 media embed 055d7584 c49b 44c4 a1d9 d689a665f287
media embed 3c17018b 9e45 49a6 854e 0ebebf2f7675 media embed 1eb5fc87 4444 4547 a589 2c839de790dc media embed c202eff5 8347 4c54 9e1e 2950d736c78c
media embed 70bf9ab9 59fd 45b3 92e6 8c745d76d3cb media embed 0a98c43f 43c9 455c 94b8 4d80f9723549 media embed 95f28ca3 1a99 4219 a221 65a8943b92f1
media embed 772e2d48 4539 405c b142 a6cf887504a0 media embed b44156a6 c9de 4621 b413 98c5b889c700 media embed 05bccd91 1eea 4574 9951 4fe266ab23c1
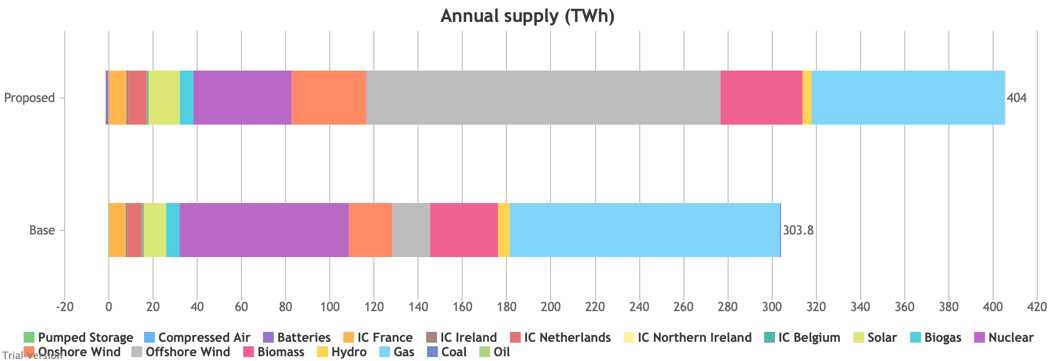
  1. Their annual contributions in this scenario (versus the status quo) look like:
    media embed 8bb97ad7 d144 4d71 bc91 3eaebf64df1f