Report section
3.3.7 Electricity supply and demand by type
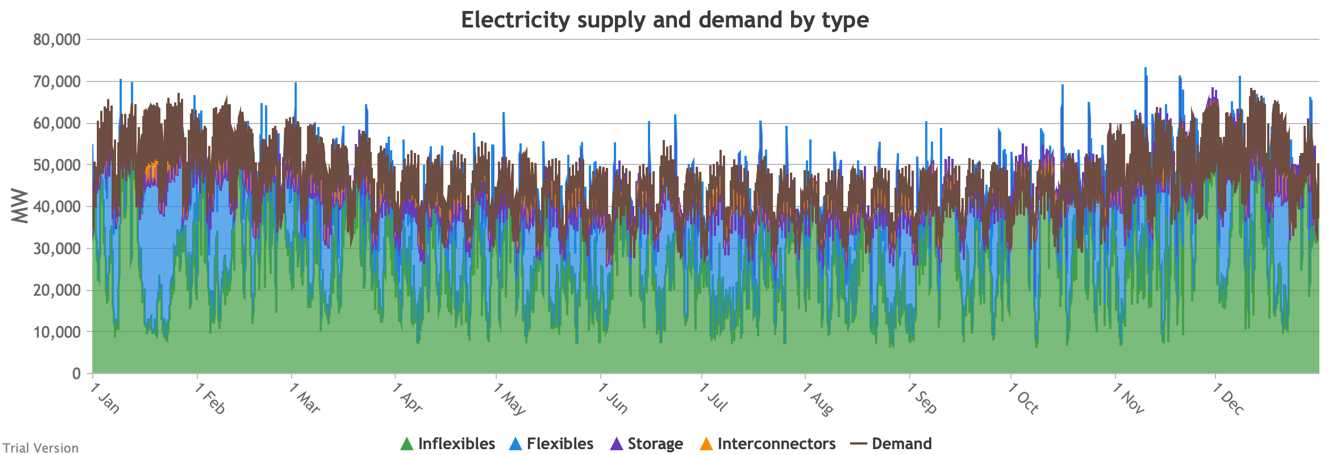
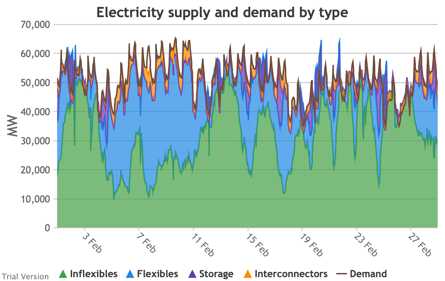
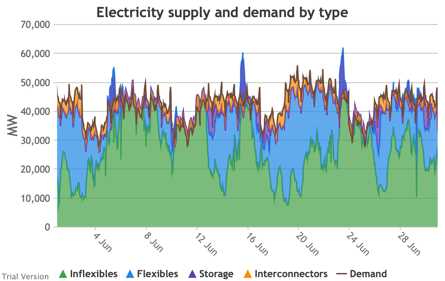
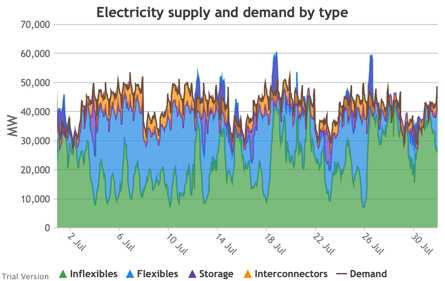
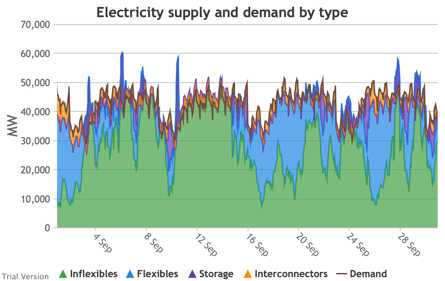
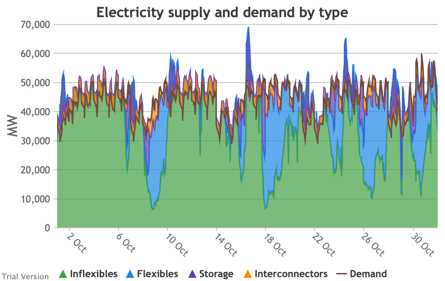
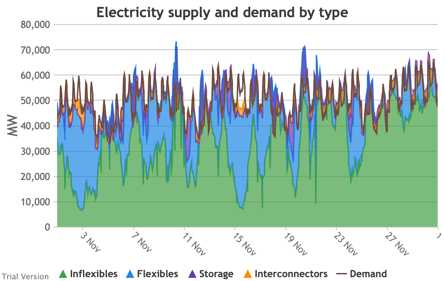
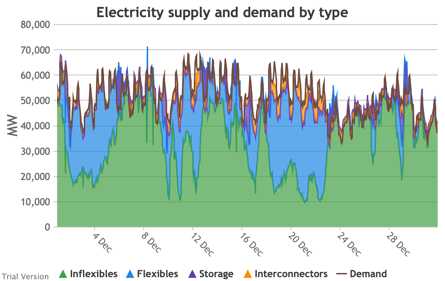
These charts show the hourly balance of demand and supply, grouped by type of technology (inflexible and flexible generation, storage and interconnectors).
|
||
|
|
|
|
|
|
|

|
|
|
|
|
- That leaves interconnectors and flexible generation to do most of the heavy lifting. Flexible, of course, mostly means carbon-emitting. That is mostly true at the other end of the interconnectors as well. And interconnectors have other constraints that are often not recognised (see section 2.2.3.9 above). Our model assumes that they take priority over native flexible generation. This scenario assumes we have expanded their capacity to 9.5 GW. Grouping technologies by type, the net effect is:
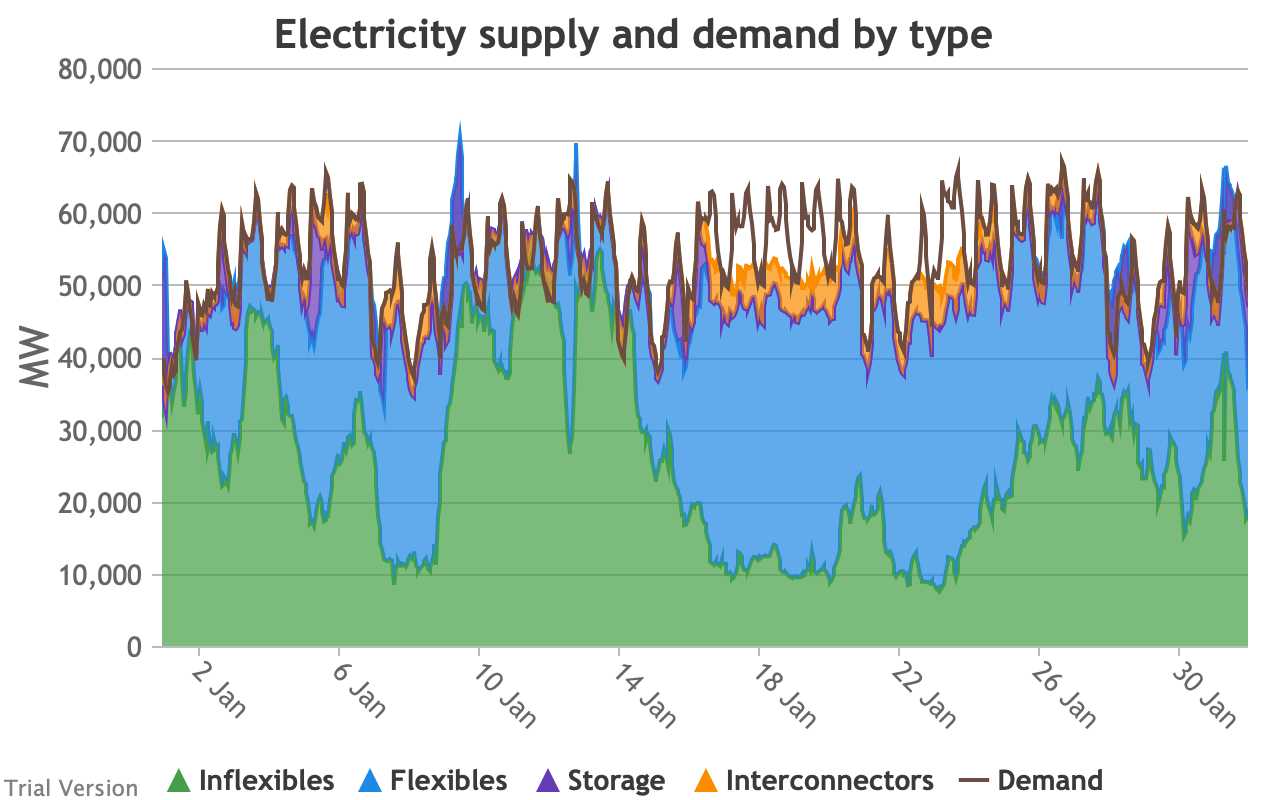
- Let’s look more closely at January to highlight some details.

- The unshaded gaps between the Demand line and the stacked Supply bands from around 17th January are periods when the combination of inflexibles, flexibles, storage and interconnectors are unable to meet demand. These are inevitably periods when demand shedding would be required. They are relatively few in this scenario, because we have only partially electrified demand and only partially decarbonised supply.
- Ceteris paribus, full electrification and decarbonisation would see these gaps becoming intolerably large and frequent.
- Even at this intermediate point in the process, that’s over 10 GW needing to be shed when the wind doesn’t blow for sustained periods.
- The conditions sustain for over a week (in working days; weekends provide some relief through lower demand).
- 10 GW means more than just down-rating a few factories, and the duration and scale shows that this would have a serious impact on businesses if we assumed that they would be the focus of demand shedding.
- As we will see below, our model puts a relatively modest cost on demand shedding at this scale. The indirect effects of unreliable energy on the economy are probably much larger than our estimate of the direct costs.
- The other periods to note are when (for example the peak around 9 Jan) the stacked Supply bands exceed the Demand line. These areas are shaded purple for Storage, i.e. they are periods when storage is charging up. Purple areas below the Demand line are when Storage is discharging.
- The same applies to the Interconnectors. Orange shaded areas above the Demand line are when the Interconnectors are exporting (net; in practice, it is often the case that some are exporting while others are exporting). Orange shaded areas below the Demand line are when the Interconnectors are importing. It is noticeable that under this scenario, the model assumes that flows will be much more strongly biased than at present in favour of imports (other than the internal, Northern Ireland interconnector, which tends to flow from GB to NI, although even that has been reduced by the system pressures of this scenario). Given similar decarbonisation strategies across the continent, it is not safe to assume that, in practice, our neighbours would be able to spare the power we need when we need it.
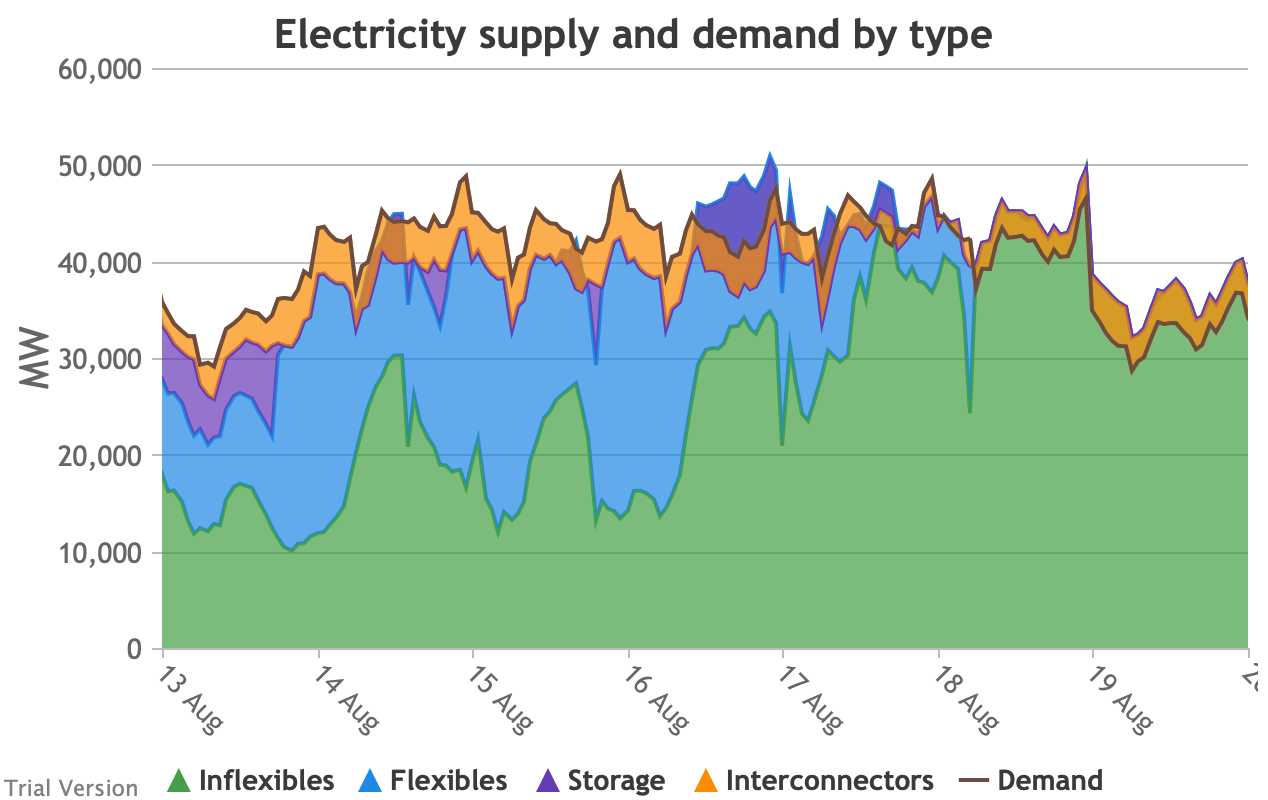
- Sometimes the Storage and Interconnector areas overlap, giving a brownish area indicating (typically) Interconnectors importing (i.e. flowing into the system) while Storage is charging (i.e. flowing out of the system). These are not easily visible in the small monthly charts above, but several of these conditions can be seen in this chart of the week beginning 13 August.
- The model does not take account of the system-stabilisation services provided by a spinning reserve of thermal generation. Profiles such as those illustrated above would require a substantial investment (not costed in the model) in STATCOMs (etc), in order for gas-fired generation to reduce to zero when inflexible generation approaches or exceeds demand.