Report section
3.3.4 Wholesale demand profile vs output from inflexible generators
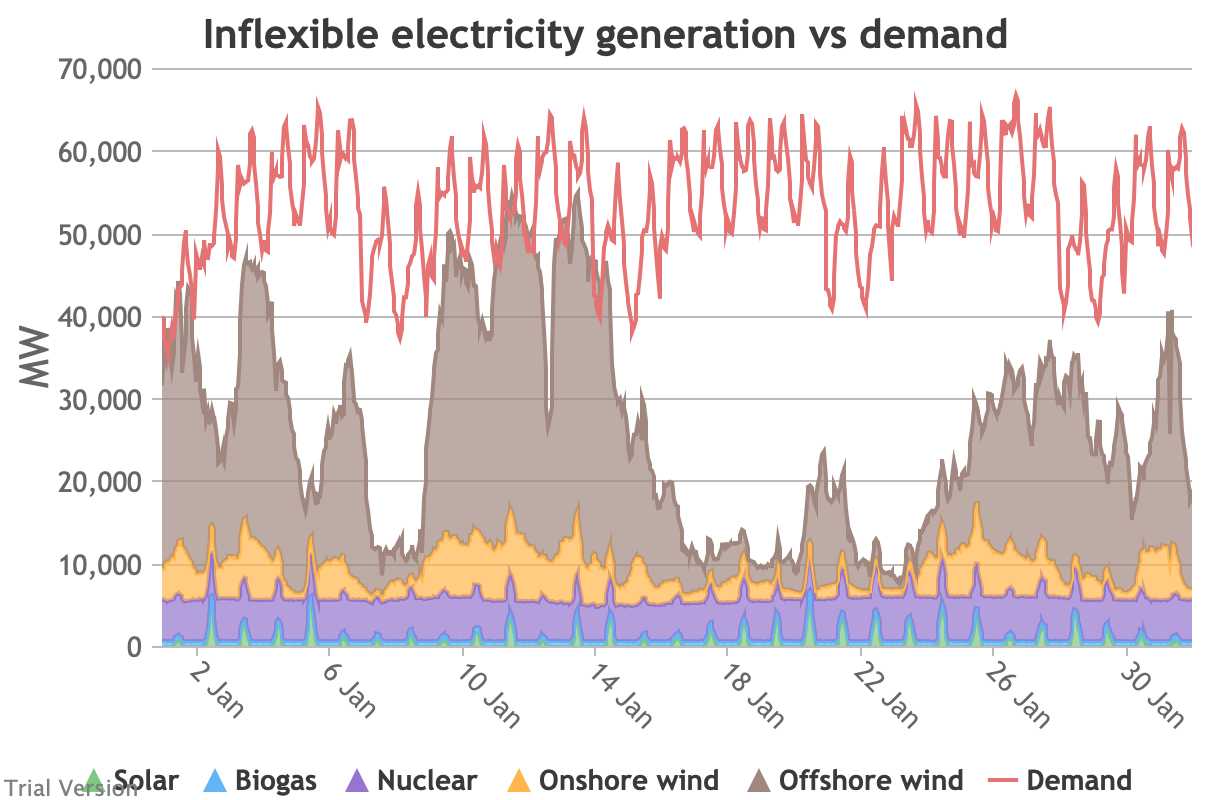
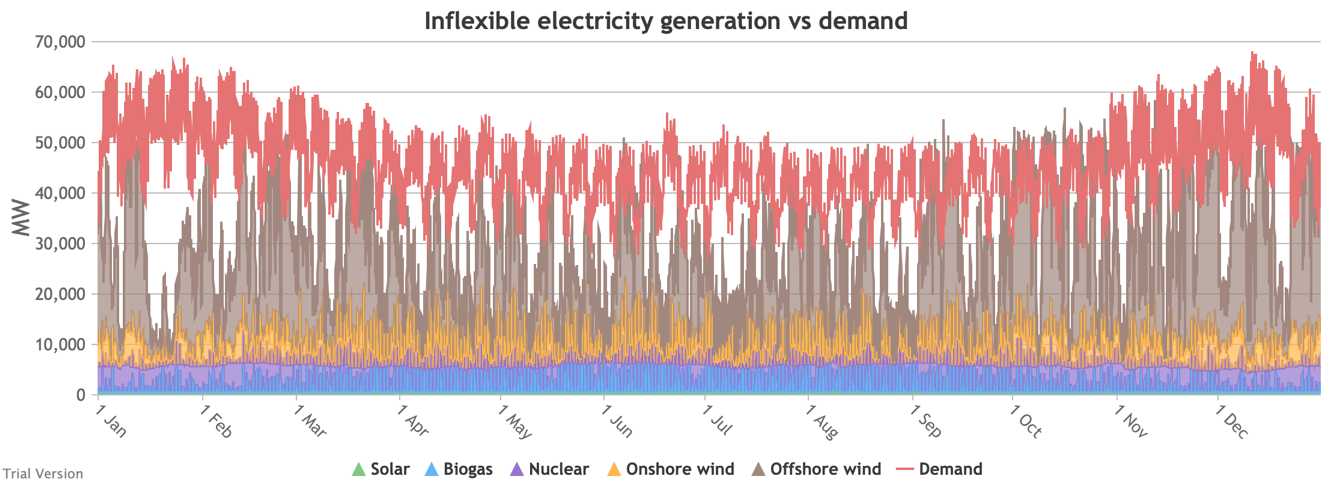
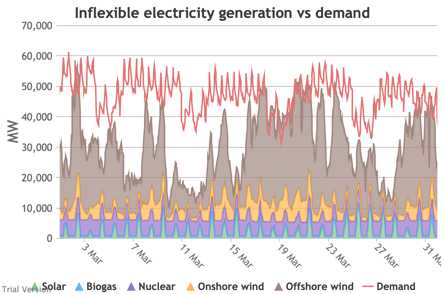
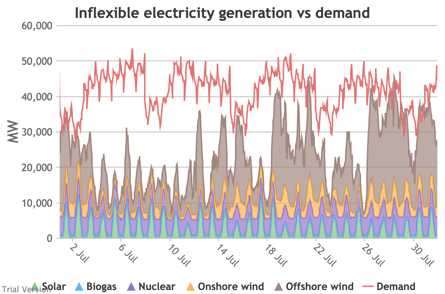
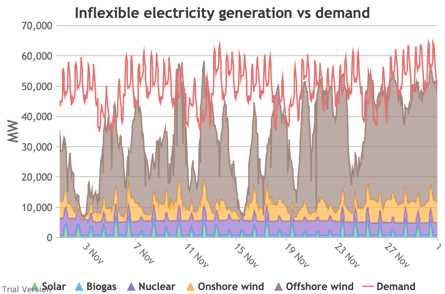
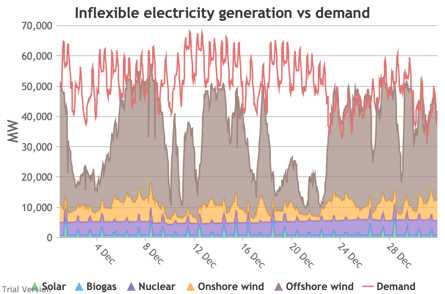
These charts compare the wholesale electricity demand profile from the previous section with the output of the inflexible generation technologies (nuclear, biogas, solar, onshore wind and offshore wind).
|
||
|
|
|
|
|
|
|
|
|
|
|
|
- This output is notional, as though there are there no constraints. Where the combined inflexible output exceeds demand, the excess may be stored or exported, and if not, it will be curtailed. So this does not necessarily indicate actual output. Curtailment is applied at a later stage. This is potential.
- This is the first step that illustrates some of the challenges of electrification:
- Even without gas, hydro, coal, oil or biomass, the inflexible technologies alone (wind, solar, biogas and nuclear) sometimes exceed total demand, even though that demand is boosted significantly by electrification. These increasing periods of excess production hurt their own load factors (and therefore costs) to some extent, and more significantly the load factors and costs of the flexible generating technologies.
- At other times, their combined output is negligible. Biogas and nuclear get a pass on this aspect – they are pretty reliable, just not very flexible (and that is more because of the incentives than because of the technology). But the combined output of onshore and offshore wind and solar is sometimes minimal. There is no regularity to it. There is little correlation with demand (solar correlates to some extent, wind not at all). It is sometimes for extended periods. Consequently, output gaps are sometimes during periods of high demand.
- Look more closely, for instance, at 16-24 January.
 Demand ranges from 50-65 GW during the working week and 40-60 GW at the weekend. The combined output of wind and solar averages 7.8 GW, out of a combined capacity of 71 GW. If you want to address this with storage, you will need enough capacity to support around 40 GW of continuous discharge for over a week. You will need to recover a lot of the cost of that storage in that period, because that amount of storage will not be called on frequently. This is the problem with using storage to address irregular intermittency. It is a bad fit. Storage is most suitable for smoothing regular imbalances (e.g. adjusting flat electricity production to fit a regular daily profile of demand). It is not technically impossible, but it is economically inadvisable. We look at storage in more detail below.