NG/E&Y potential: 270 - 629m m3
Credible potential: 0 - 100m m3
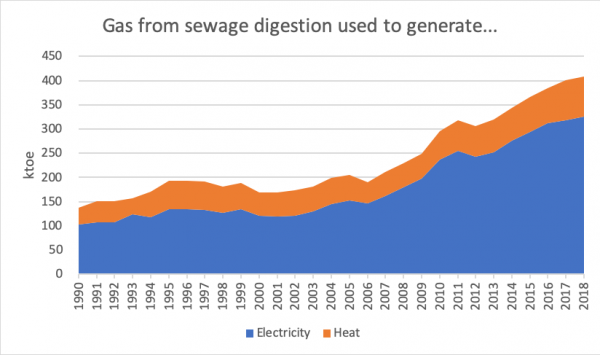
At the time, approximately 180 ktoe (2.1 TWh) of gas was being produced by sewage digestion for electricity generation, and another 50 ktoe (580 GWh) of sewage gas was being produced for heat.[1] That is around 247 million m3.
Waste-water processing needs a considerable amount of heat and power. CHP is a good fit, as much of the energy can be used on site. None of the above gas was being scrubbed and injected into the grid (even assuming there was a grid connection at the sewage works to inject into). There was no reason for the water companies to change their process, so that they would export their scrubbed biogas and import some other forms of energy to run their processes.
Water companies had had practical reasons to produce their own energy for a long time, and had additionally been incentivised to do so under the NFFO and the RO. Consequently, they started from a relatively high level and had already expanded their production considerably by 2009.
Gas production is only practical at the larger sewage works, most of which were already doing so. The question of scale would be doubly significant for grid injection, as the smaller, more remote sewage works were less likely to be on the gas grid, as well as being less suitable for gas production. And to the extent that there was some remaining potential, new sites would have the same reasons as existing sites to deploy CHP rather than grid injection.
By 2018, sewage gas production had increased to 325 ktoe (3.8 TWh) for electricity and 83 ktoe (965 GWh) for heat. That is equivalent to around 438m m3. Despite the incentives being skewed to favour biomethane, almost none of it was being injected into the grid.[2]
There was never much prospect that 270m m3 would be diverted from CHP to grid injection. There was even less prospect that 629m m3 of sewage gas would be produced by 2020, let alone be diverted 100% to the grid.
[1] ktoe = thousand tonnes of oil equivalent. TWh = tera watt-hour = 1,000,000 MWh. Data from Digest of UK Energy Statistics (DUKES) 2019, Table 6.1.1. https://www.gov.uk/government/statistics/digest-of-uk-energy-statistics-dukes-2019. It is not clear from the statistics if the gas for electricity and for heat was separate or the same gas with additional energy extracted where CHP was deployed. We assume here the most generous case for E&Y’s model, though the methodology for calculation of the values suggests that it is actually the same gas.
[2] The Renewables Obligation was modified in 2009 so that new sewage gas plants received only ½ a ROC per MWh (previously 1 ROC per MWh). The value depended on the buyout price and the recycled value, but roughly this equated to a cut from around £48/MWh to £24/MWh. Sewage gas was not eligible for Feed-In Tariffs.
Biomethane (e.g. grid injection) received £68/MWh regardless of scale when the RHI was introduced in late 2011. Biogas heat (e.g. the heat from an AD CHP scheme) also received £68/MWh, but only for a small amount of heat, upto 200 kW, above which biogas initially received nothing. This was subsequently modified to offer lower tariffs for larger schemes, as was the biomethane support.
As the RO and RHI for biogas heat were paid after conversion, whereas the RHI for biomethane was paid before conversion (e.g. in houses, or power stations or wherever the gas was used), around 2012/13, a sewage plant producing 2m m3 of biogas (≈ 800,000 m3 of CH4) p.a. could receive around £560,000 p.a. of RHI for biomethane, £83,000 of RO for electricity generation and/or £113,000 of RHI for heat production. Yet water companies opted almost universally for CHP rather than biomethane.

