
Report section
2.2.2 Weather
- The external temperature is the most important factor in the levels of heat demand. But the relationship between temperature and heat demand is revealed primarily by comparing temperatures with the use of the primary heating fuel: gas. Unfortunately, unlike electricity, most gas is not metered on a frequent basis. Two academic studies attempted to overcome this by estimating daily profiles that could be applied to the daily figures for gas-use available from National Grid to generate synthetic granular heat-demand data:
-
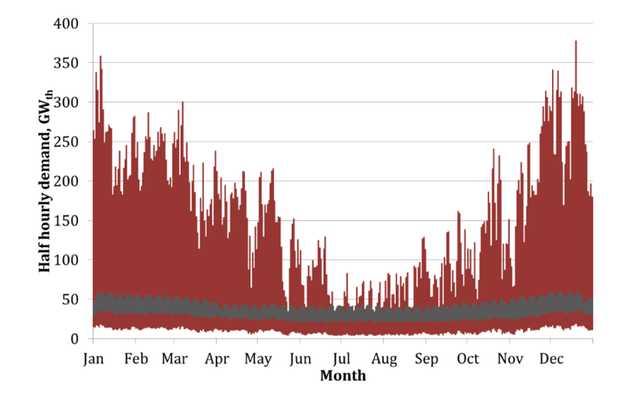 The ground-breaking research of Robert Sansom at Imperial College London generated the first profile of half-hourly heat demand, reflected in the chart to the right that has become famous in energy-policy circles for illustrating the challenge of matching heat demand to inflexible sources:[1]
 -
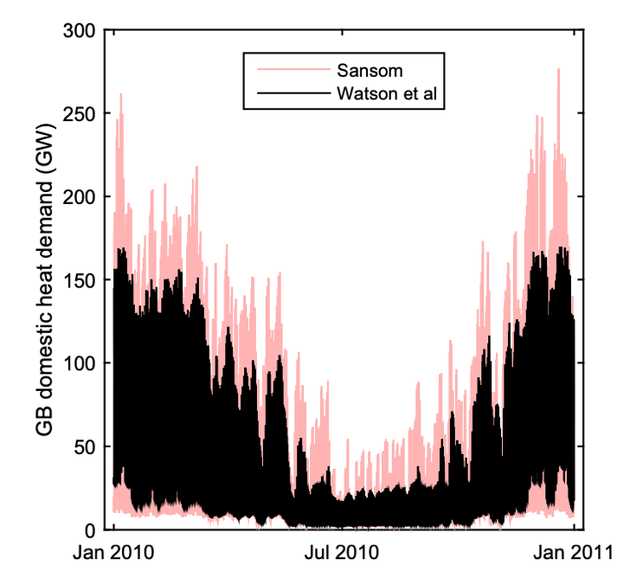 Recently, Watson, Lomas and Buswell of Loughborough University made some well-founded modifications to Sansom’s model that reduced its “peakiness”.[2] The observation that heat demand would be spread more widely over the day in cold conditions with high demand (rather than simply increased pro rata in each period) is both intuitive and consistent with the large dataset that they used. The difference with Sansom is illustrated in the chart from their paper to the right.
-
We adopted their “less-peaky” heat-demand profiles to convert National Grid’s daily gas-demand figures into reasonable synthetic hourly figures.[3] The somewhat-flattened profile reduces the balancing challenge, but comparing the two charts above should illustrate that heat demand remains significantly larger and more variable than electricity demand (the grey line in Sansom’s chart).
- The available solar figures do not reflect national output, and
- The embedded solar is treated as negative demand and affects Elexon’s demand figures
However, the profile of grid-connected solar output is probably reasonably reflective of the profile of total solar output (although the embedded solar is probably somewhat less optimally positioned on average). So we can use Elexon’s solar figures for the hourly solar profile whilst discarding the absolute figures as only a fraction of the true figure. In our model, we treat solar as one homogeneous lump of capacity (undifferentiated as grid-connected or embedded), and likewise electricity demand as a gross figure exclusive of any embedded power, to minimise complexity. That means that the model figures for electricity demand will not match the metered figures and the figures in national statistics. But reverse-engineering these figures (by applying the solar profile to an estimate of embedded capacity based on subtracting the public figures for total capacity from Elexon’s figures for grid-connected capacity) should be reasonably accurate, and produce the same net effect.
[1] https://spiral.imperial.ac.uk/bitstream/10044/1/25503/1/Sansom-R-2015-PhD-Thesis.pdf
[2] https://www.sciencedirect.com/science/article/pii/S0301421518307249#bib29
[3] https://mip-prd-web.azurewebsites.net/DataItemExplorer
[4] We extracted this data while the Met Office had made their APIs freely available to the public, enabling us to download hourly data for their measurement points around the country. Unfortunately, they closed the public access in 2019, which is why our model uses data for the years 2016-2018, which were the years for which we obtained complete datasets before the API was closed.
[5] https://www.bmreports.com/bmrs/