
C4CS analysis
Forever learning curves

A certain type of green technology evangelist is wetting themselves over this chart.
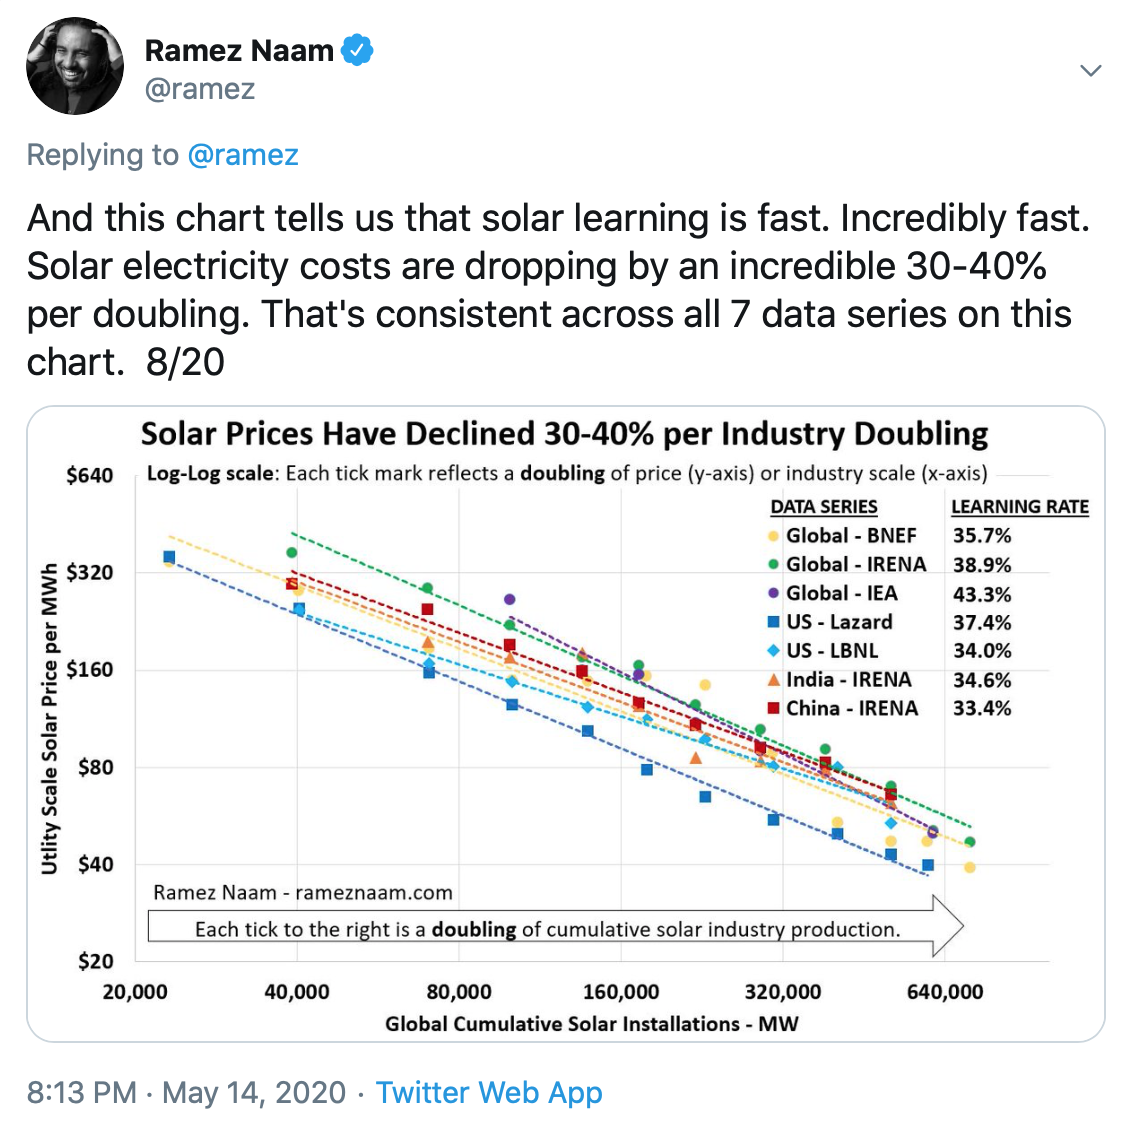

It implies (and the author goes on to argue explicitly) that this kind of exponential cost-reduction can continue indefinitely.
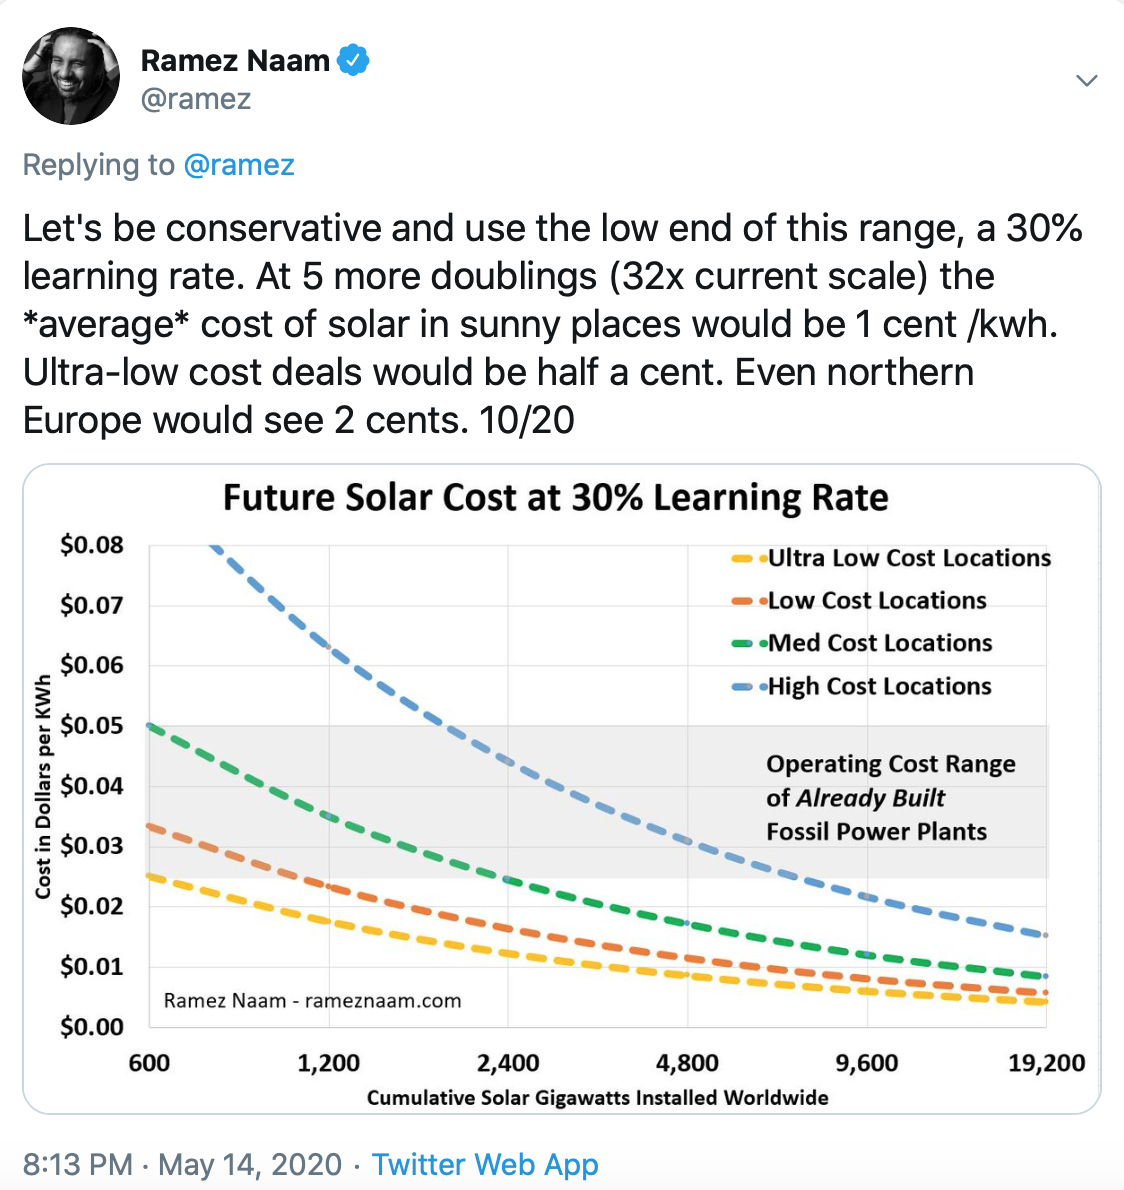

Let's be clear what that means. Global solar output in 2019 was 699 TWh from around 650 GW of capacity. Global electricity generation from all technologies was around 27,000 TWh from around 8,000 GW of capacity. So solar was contributing around 2.6% from 8% of the capacity.
If solar doubles 5 more times from here, it will have a capacity of 20,800 GW, or 2.5 times current global generating capacity of all technologies. And it will produce 22,400 TWh, or 83% of current total generation.
Most of that generation/consumption occurs outside the tropics:
https://ourworldindata.org/grapher/energy-use-per-capita">https://ourworldindata.org/grapher/energy-use-per-capita
So most of that solar production will have a strong element of seasonality about it. At peak production, solar output will produce an order of magnitude more electricity than required. Throughout the winter, which in most temperate countries coincides with peak demand, solar will contribute little.
"So we need lots of storage", the green tech evangelists will say. But the economics of storage are heavily dependent on the frequency of charge/discharge. Ideally / in practical current use / in most calculations of its cost, storage operates on one or two cycles per day. Interseasonal storage, from summer to winter, will be hundreds of times more expensive, because it will have only one or two charge/discharge cycles a year.
Anyway, it's a false premise. Learning curves no more go on forever than "it's turtles all the way down". In fact, isn't one of the greens' favourite quotes (applied to growth/consumption), Herbert Stein's: "If something cannot go on forever, it will stop"?
https://www.oecd.org/env/cc/2047106.pdf">https://www.oecd.org/env/cc/2047106.pdf
We've seen these learning curves before. The UK's first low-carbon electricity support scheme was the Non-Fossil Fuel Obligation (NFFO). This is how the price declined in the 5 tranches of NFFO in England & Wales between 1990 and 1998 (from a presentation to the OECD by the UK Department for Trade & Industry in 1999).
Fast forward to 2020, and the estimated Levelised Costs of Energy (LCOE) for these technologies in the UK are (BEIS figures, see also Arup's supporting report):
| p/kWh | in 2016 £s | in 1999 £s | ||||
| Low | Central | High | Low | Central | High | |
| Landfill gas | 4.3 | 6.7 | 9.1 | 2.7 | 4.2 | 5.7 |
| Energy from Waste | 2.4 | 4.5 | 8.3 | 1.5 | 2.8 | 5.2 |
| Wind (onshore) | 4.7 | 6.3 | 7.6 | 2.9 | 3.9 | 4.8 |
At the central value, none of these technologies is cheaper now than it was in 1999. Only EfW is cheaper at the low value, and that is based entirely on optimistic assumptions about the gate fee (the price paid to dispose of the waste via EfW). Despite significant declines in the first decade, technology costs have not reduced for 20 years. In fact, they have increased.
Let's compare these figures with the prices in that chart in the beginning. Solar has achieved a bigger reduction, but primarily because it was astronomically expensive initially, not because it is cheap now. $320/MWh was around 25p/kWh! And indeed, solar received higher subsidies than that initially, although not at utility scale.
If solar is becoming competitive and may become more so, that's something to celebrate. But it is no reason to surrender to hyperbole. Solar capacity will not double five times from here. And its cost will not fall to 1p/kWh. In fact, if history is anything to go by, its cost will probably stabilise or start nudging upwards.
When we look at the increasing instances of intermittent over-production at peak as their capacity increases, the dominant force in the future may be a Hobson's Choice:
(a) subsidise the production enough that it keeps producing even when no one wants it and its value is negative, in which case wholesale costs will continue on downwards, but the true cost including the subsidy will increase, or
(b) pull the subsidies apart from a carbon price, in which case it will not be worth producing at negative cost and output will be increasingly curtailed, increasing the price required to breakeven on the un-curtailed output.
Either way, the upwards cost pressures should gradually overwhelm any remaining learning curve reductions, when all costs are taken into account.