National Grid / Ernst & Young's claims for biomethane vs reality
National Grid / Ernst & Young's claims for biomethane vs reality Bruno Prior Thu, 13/02/2020 - 15:50The claims
The claims Bruno Prior Thu, 13/02/2020 - 15:52National Grid and Ernst & Young concluded that:
Renewable gas has the potential to make a significant contribution to the UK’s renewable energy and carbon reduction targets for 2020. And in the longer term, with the right government policies in place, renewable gas could meet up to 50% of UK residential gas demand.
In terms of the cost to the UK of delivering renewable gas, it is estimated that the marginal cost… would be in the region of £10bn. This cost compares well with the likely cost of delivering other large scale renewables such as wind. The unit cost of renewable gas would be of a similar level to the cost of other sources of renewable energy which are currently supported with subsidies.
They petitioned for the following policy measures:
◆ A commercial incentive for renewable gas producers to upgrade and grid-inject their gas rather than generate electricity which is currently incentivised under the RO scheme despite being a generally much less efficient use of the valuable waste stream;
◆ A comprehensive waste management policy for the UK to ensure that each waste stream is directed to the most appropriate technology to maximise energy recovery and recycling
◆ A regulatory framework to provide incentives and to clarify the roles and responsibilities of the gas transporters with respect to renewable gas connections;
◆ Continued support for R&D in renewable gas production and upgrade technologies.
And they highlighted that the purpose of the report was to persuade the government to reduce its expectations of other technologies:
Renewable gas…is a unique, large scale solution which unlike other options such as district heating and heat pumps utilises existing heat infrastructure (i.e. gas grids) already largely paid for by the consumer. So renewable gas does not require consumers to find the money for new heating installations in the home and also avoids the disruptive road works that would be required to build more network infrastructure.
There was nothing subtle about the rent-seeking. Nor was there much credible analysis underpinning it.
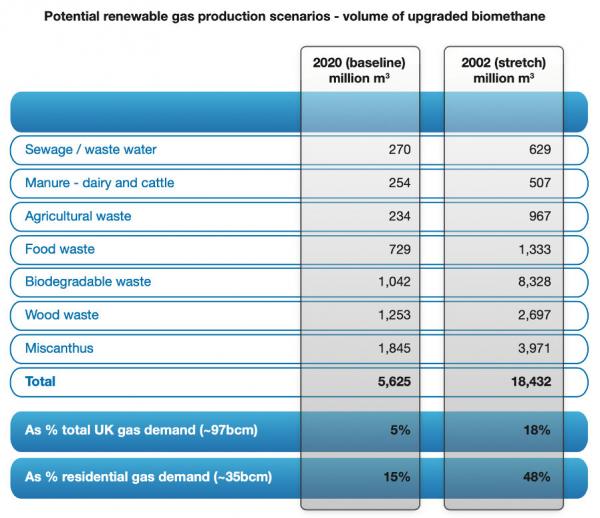
The core of their claims was an analysis of the resource, which claimed much larger numbers than previous research. The biggest factor in this was the inclusion of gasification gas as well as digester gas, as this allowed them to count feedstocks that could not realistically be converted to gas by AD. In the table below, the last two items were intended for gasification. But they also upgraded significantly the claimed potential for biogas.
The “Baseline” scenario considers a world where a significant proportion of waste still goes to landfill, is not sorted appropriately or is still used for electricity generation – rather than being used for renewable gas production. The “Stretch” scenario aims to see what could be achieved with renewable gas if policies are put in place to ensure that all waste is directed towards renewable gas production and that the most appropriate (high yielding) technology is used for each type of waste.
How does this compare with reality?
Sewage / waste water
Sewage / waste water Bruno Prior Thu, 13/02/2020 - 15:54NG/E&Y potential: 270 - 629m m3
Credible potential: 0 - 100m m3
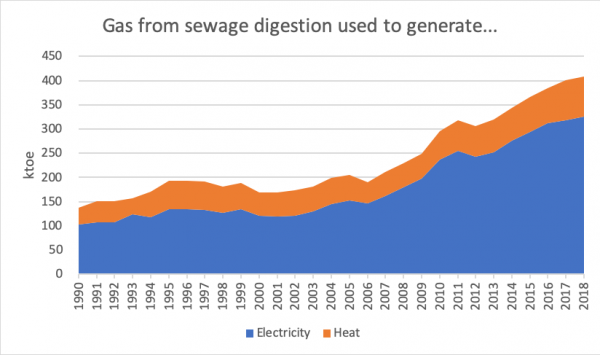
At the time, approximately 180 ktoe (2.1 TWh) of gas was being produced by sewage digestion for electricity generation, and another 50 ktoe (580 GWh) of sewage gas was being produced for heat.[1] That is around 247 million m3.
Waste-water processing needs a considerable amount of heat and power. CHP is a good fit, as much of the energy can be used on site. None of the above gas was being scrubbed and injected into the grid (even assuming there was a grid connection at the sewage works to inject into). There was no reason for the water companies to change their process, so that they would export their scrubbed biogas and import some other forms of energy to run their processes.
Water companies had had practical reasons to produce their own energy for a long time, and had additionally been incentivised to do so under the NFFO and the RO. Consequently, they started from a relatively high level and had already expanded their production considerably by 2009.
Gas production is only practical at the larger sewage works, most of which were already doing so. The question of scale would be doubly significant for grid injection, as the smaller, more remote sewage works were less likely to be on the gas grid, as well as being less suitable for gas production. And to the extent that there was some remaining potential, new sites would have the same reasons as existing sites to deploy CHP rather than grid injection.
By 2018, sewage gas production had increased to 325 ktoe (3.8 TWh) for electricity and 83 ktoe (965 GWh) for heat. That is equivalent to around 438m m3. Despite the incentives being skewed to favour biomethane, almost none of it was being injected into the grid.[2]
There was never much prospect that 270m m3 would be diverted from CHP to grid injection. There was even less prospect that 629m m3 of sewage gas would be produced by 2020, let alone be diverted 100% to the grid.
[1] ktoe = thousand tonnes of oil equivalent. TWh = tera watt-hour = 1,000,000 MWh. Data from Digest of UK Energy Statistics (DUKES) 2019, Table 6.1.1. https://www.gov.uk/government/statistics/digest-of-uk-energy-statistics-dukes-2019. It is not clear from the statistics if the gas for electricity and for heat was separate or the same gas with additional energy extracted where CHP was deployed. We assume here the most generous case for E&Y’s model, though the methodology for calculation of the values suggests that it is actually the same gas.
[2] The Renewables Obligation was modified in 2009 so that new sewage gas plants received only ½ a ROC per MWh (previously 1 ROC per MWh). The value depended on the buyout price and the recycled value, but roughly this equated to a cut from around £48/MWh to £24/MWh. Sewage gas was not eligible for Feed-In Tariffs.
Biomethane (e.g. grid injection) received £68/MWh regardless of scale when the RHI was introduced in late 2011. Biogas heat (e.g. the heat from an AD CHP scheme) also received £68/MWh, but only for a small amount of heat, upto 200 kW, above which biogas initially received nothing. This was subsequently modified to offer lower tariffs for larger schemes, as was the biomethane support.
As the RO and RHI for biogas heat were paid after conversion, whereas the RHI for biomethane was paid before conversion (e.g. in houses, or power stations or wherever the gas was used), around 2012/13, a sewage plant producing 2m m3 of biogas (≈ 800,000 m3 of CH4) p.a. could receive around £560,000 p.a. of RHI for biomethane, £83,000 of RO for electricity generation and/or £113,000 of RHI for heat production. Yet water companies opted almost universally for CHP rather than biomethane.
Manure - dairy & cattle
Manure - dairy & cattle Bruno Prior Thu, 13/02/2020 - 16:12NG/E&Y potential: 254 - 507m m3
Credible potential: 0 - 33% of high-gas feedstocks
One of the first commercial AD plants in the UK, Holsworthy Biogas, was originally obliged to take 80% of its feedstock from farm slurry. It was not economic under this constraint, and went into administration. It only became viable when its new owners (Summerleaze) broke the obligation and switched the plant to mostly food waste.
Cattle manure and slurry produce a fraction of the gas per tonne of (wet) feedstock, compared to food waste, and less still than energy crops. Waste attracts a gate fee (albeit significantly diminished nowadays due to over-capacity), whereas farmers will not generally pay to get rid of their manure. The manure intake therefore represents a cost not an income, because it has to be transported to the digester.
On-farm digesters may mitigate some of these disadvantages by minimising the transport distance and utilising the energy on-site, which offers a higher value than export as gas or electricity. Specialist farm digesters can also be cheaper, as they can be simpler than digesters that handle waste. And digestate disposal directly on the farm may be cheaper.[1]However, they will tend to be smaller, and will often not be located on the gas grid. In the rare cases where the benefits of localism are sufficient to outweigh the poor economic fundamentals of slurry digestion, the opportunities for grid injection may be limited.
There is thought to be a substantial resource of manure and farm slurry. In England and Wales, it is estimated that approximately 72m tonnes is collected for spreading, and another 73m tonnes is deposited directly in the fields by the animals.[2] Of this, dairy and beef accounts for nearly 60m tonnes of the spread material and 42m tonnes of the directly-deposited material. At around 15 m3/tonne, this implies a theoretical potential of 900m m3 of methane from AD, if all the collected dairy and beef manure/slurry were digested before spreading.
Yet the production of biogas from this material was negligible at the time of the NG/E&Y report, and remains insignificant today, despite the stimulus efforts. A 2017 report by Ricardo for ClimateXChange identified:[3]
the amount of slurry and FYM that could be treated in this manner is likely to be modest and there is a current declining trend in food waste production.
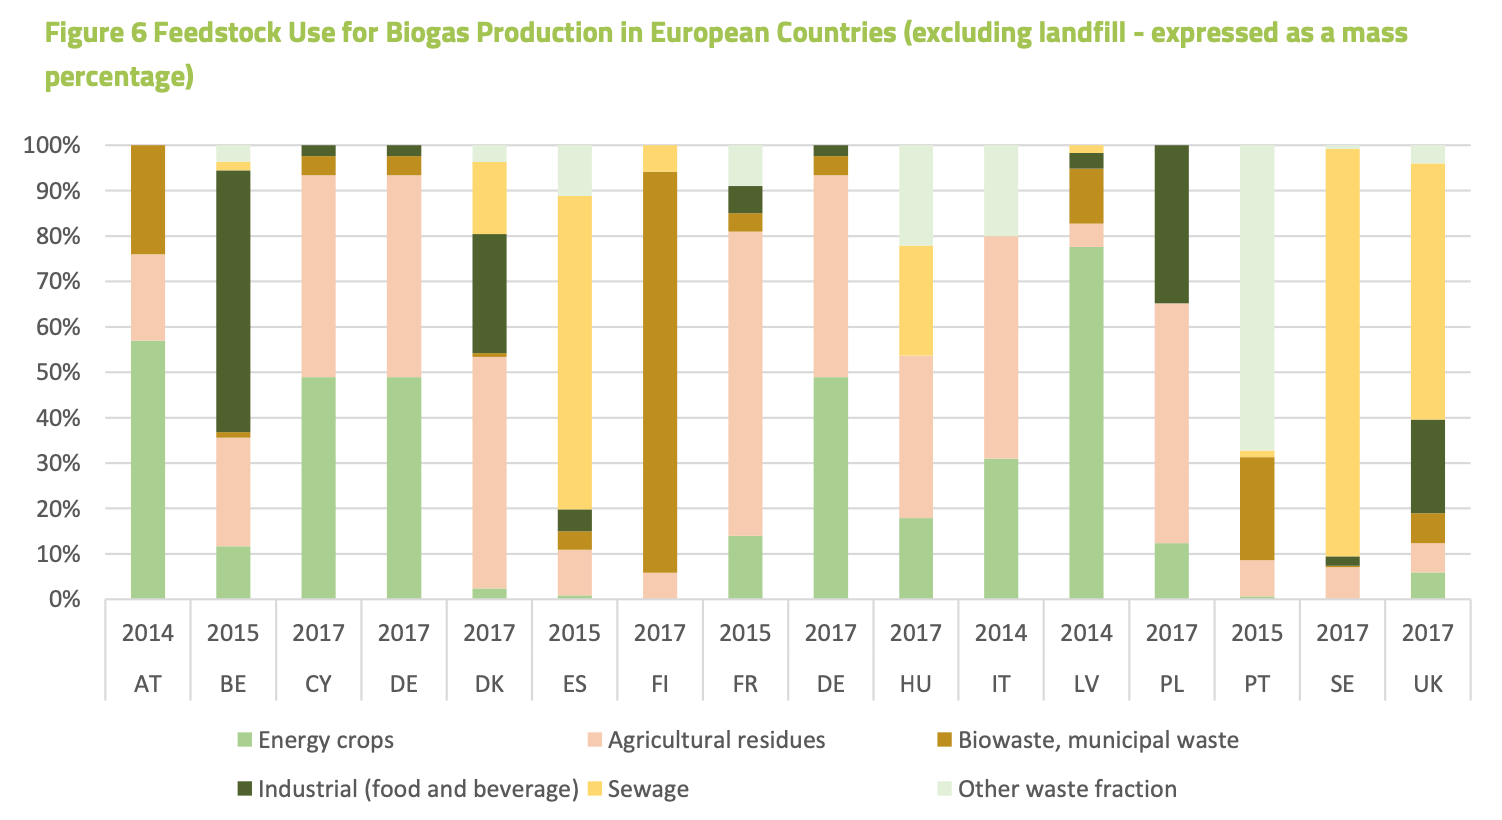
Bioenergy Europe note that:[4]
The utilisation of agricultural residues such as manure is particularly important in countries such as Denmark, France and Italy
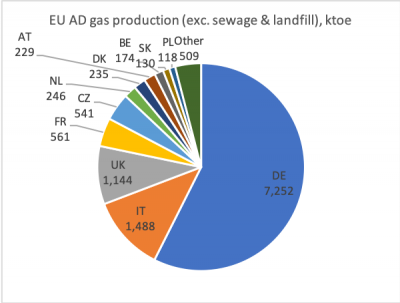
Yet biogas as a whole constitutes 2.1%, 0.4% and 1.3% of those countries’ primary energy consumption. Agricultural residues constitute 51%, 68% and 49% (by mass) of their biogas feedstock. Given the lower gas-producing potential of the feedstock, that means that in the European countries that have placed greatest emphasis on manure as a biogas feedstock, it is responsible for around 0.75%, 0.2% and 0.4% of their primary energy consumption. That is particularly striking in Denmark, which is noted for its successful promotion of renewables, has the infrastructure (e.g. municipal district heating schemes) to maximise the value of AD plants, and has large quantities of pig (and other) slurries to digest.
If we combine the fact that farm slurries are generally uneconomic but may have limited potential as a complement to higher-gas feedstocks, with the experience in the countries that have tried hardest to use this material, we may conclude that the maximum practical proportion of the feedstock is around 50% by mass, which equates to around 25% of the gas potential (i.e. if we work out the potential of other feedstocks, we could add up to 33% for co-digestion of this material).
The reality of digesting manure is that, while the theoretical potential is quite large, the economic potential is small and always has been. NG/E&Y were not making abstract claims about the theoretical potential. They were claiming not only that biomethane could supply nearly half our domestic gas, but that the level of support needed to achieve that was modest. The combination of these two claims with regard to manure is disingenuous.
[1] Depends on the nitrate vulnerability of the land, but digestion is unlikely to make the problem worse than the previous way that slurry was handled on the farm. Larger, centralised AD systems will need a wider area over which to spread their digestate, and the process will be more complex and expensive if the centralised system also took food waste.
[2] Nicholson, F.; Chambers, B.; Lord, E.; Bessey, R. ; Misselbrook, T. (2016). Estimates of manure volumes by livestock type and land use for England and Wales. NERC Environmental Information Data Centre. https://doi.org/10.5285/517717f7-d044-42cf-a332-a257e0e80b5c
[3] Ricardo Energy & Environment, “Farmyard Manure and Slurry Management and Anaerobic Digestion in Scotland – Practical Application on Farm” https://www.climatexchange.org.uk/media/2977/farmyard-manure-and-slurry…
[4] Bioenergy Europe, Statistical Report 2019 https://bioenergyeurope.org/statistical-report.html
2018 biogas production (ktoe): DK: 389; FR: 899, IT: 1,898. 2018 primary energy consumption (from https://appsso.eurostat.ec.europa.eu/nui/show.do?dataset=nrg_bal_s&lang=en): DK: 17,958; FR: 238,910; IT: 147,244)
Agricultural waste
Agricultural waste Bruno Prior Thu, 13/02/2020 - 17:13NG/E&Y potential: 234 - 967m m3
Credible potential: 0 - 100m m3
Agricultural waste was brought within waste management regulations in 2006. The vast majority of agricultural waste was the slurries and manures. Of the remainder, the focus was on handling the plastics.[1]
There was growing consideration of anaerobic digestion, and more limited consideration of on-farm non-slurry agricultural waste, but little consideration of the two together, perhaps reflecting the reality that the quantities were modest and already used for practical purposes (e.g. animal feed or composting).
In the Anaerobic Digestate protocol produced by WRAP in Feb 2009, for instance, agricultural waste was treated as though it was entirely about slurries and manure.[2]
The 2007 report by the Biomass Task Force (chaired by a former NFU chairman) focused strongly on the role of agriculture, but did not identify any “wet” agricultural wastes other than slurries suitable for digestion.[3] It did highlight significant volumes of “dry” agricultural waste such as straw, suitable for thermal processes (e.g. gasification).
The Environment Agency’s recommendations for Agricultural Waste, published in 2001 offered the following figures:[4]
| Waste milk: | 23,993 tonnes |
| Vegetable & cereal residues: | 1,091,984 tonnes |
| Animal carcasses: | 231,785 tonnes |
| Animal tissue: | 111,972 tonnes |
It is likely that a lot of the animal material would have needed to go to rendering. 100m m3 of biomethane looks like a stretch as the potential of this resource if it were all digested. And there was no reason to think that it would all be digested, rather than continuing to be used for the valuable and environmental uses (e.g. animal feed) to which it was being put.
It has not been possible to identify any quantification, nor much reference, to non-slurry agricultural wastes being used as AD feedstocks at the time of E&Y’s report. A small number of on-farm digesters fed primarily with slurry/manure were noted, and it is reasonable to infer that they would also have use any other putrescible material available. But it is hard to see on what basis a researcher could have concluded that there was any significant current contribution from this material in 2009, from which to project a large contribution in 2020.
Yet E&Y estimated the baseline contribution at 234m m3, and the “stretch” contribution at 967m m3 – nearly double the “stretch” contribution of the slurries and manures that dominated the statistics and analysis of the resource.
Fast forward to their target date, and WRAP recently estimated the amount of on-farm food waste and surplus produce as 3.6m tonnes.[5] Their objective, as always, was to minimise this waste, not to maximise its use for digestion. Most of it is already re-purposed, for example as animal feed. As the 2017 report for ClimateXChange, cited above, notes, there are few known instances of the digestion of this material to produce gas, whether for on-site use or grid injection. There is little reason to think now that a significant amount of gas will be produced from this material as efforts to minimise it proceed, and there was little reason in 2009 to expect much either.
[1] e.g. DEFRA, Waste Strategy for England (2007), ¶ 43 https://assets.publishing.service.gov.uk/government/uploads/system/uplo…
[3] UK Biomass Strategy 2007, Annex A refers generically to food wastes, but note 11 makes clear that this refers to municipal and other off-farm waste streams.
[4] EA, Towards sustainable agricultural waste management, https://assets.publishing.service.gov.uk/government/uploads/system/uplo…
Food waste
Food waste Bruno Prior Thu, 13/02/2020 - 17:29NG/E&Y potential: 729 - 1,333m m3
Credible potential: 250 - 750m m3
Other than sewage, food waste (post-farm-gate) is the main feedstock (around 50%) of anaerobic digestion in the UK, because it has a good gas yield and historically some waste-disposal income (i.e. gate fee).[1]
There was very little anaerobic digestion (other than sewage and landfill gas) in 2009. This was one area where there was genuine potential for a material increase in gas production, whether for electricity, heat or biomethane. If policies had directed all the material to biomethane, E&Y could reasonably have claimed all the gas potential from this material.
Food waste was a hot topic in the years up to 2009. On the upside, the resource was large. 3.6m tonnes of domestic food was thought to be wasted annually.[2] Estimates of Commercial & Industrial (C&I) food wastes varied widely, depending on reporting and definition, but pointed to around 3.5m tonnes excluding compostable/garden waste.[3]
On the downside, the policy preference for this material was not to utilise it for energy, but to reduce it.[4] That, of course, would reduce its potential as a feedstock for AD. Half the resource (the domestic element) was not available to digesters unless councils chose to implement separate collection, and would depend on the efficiency with which the public separated their waste.
With full source-separation and collection, and no waste-reduction, this material had the potential for up to around 750m m3. A prudent assessment would have assumed some minimisation and incomplete collection, and some use for the generation of electricity and/or heat (e.g. where large food-waste producers produced their own gas for their own processes on site).
History bares out the prudent judgment. Significantly more of the resource went to electricity and heat than to biomethane.[5]Separate collection remains incomplete. Significant efforts are being made to reduce the volume of food waste, or to divert the material to other uses perceived as higher value.
WRAP are actively promoting the diversion of material that currently goes to anaerobic digestion to uses such as animal feed.[6]
Arla have worked with their partners to send 100% of surplus food from their largest factory to animal feed, instead of anaerobic digestion
Tesco and SugaRich have worked together to divert 80% of surplus bakery products from anaerobic digestion to animal feed.
By diverting surplus soft drink products away from anaerobic digestion to redistribution and animal feed, Coca-Cola Enterprises have created net cost savings
WRAP announced recently that food-waste volumes fell 7% between 2015 and 2018, an acceleration of the trend from 2007-15, when volumes fell around 11%.[7] They nevertheless note that a significant proportion remains uncollected and the public continue to under-estimate the significance. The Committee on Climate Change’s recent report on and plan for land-use envisages another 20% reduction by 2030.[8]
Reality is demonstrating what could reasonably have been inferred by a knowledgeable analyst in 2009: there was plenty of scope to increase the digestion of food waste, but it was a declining resource that was unlikely to be captured fully for the purposes of generating biomethane. A range of 250 – 750m m3 represents an optimistic assumption that one-third to 100% of it would be captured and used for biomethane, and the decline would not be significant. It is hard to understand how one credibly arrives at a higher figure than that.
[1] Bioenergy Europe, Statistical Report 2019, Biogas section, Figure 6, p.12.
[2] http://news.bbc.co.uk/1/hi/uk/7389351.stm. DEFRA figures suggested English municipal waste contained 5m tonnes of food waste. The discrepancy can possibly be explained as recoverable vs total. https://www.gov.uk/government/uploads/system/uploads/attachment_data/fi…
[3] Enviors for WRAP, Commercial and industrial organic waste arisings – a gap analysis (2009)
https://www.wrap.org.uk/sites/files/wrap/Gap%20analysis%20-%20techical%… . The larger numbers included all animal and vegetal waste, including garden waste and other material more suitable for composting.
[5] The chart uses data from DUKES 2019, Table 6.1.1. It is subject to the same proviso mentioned in a previous footnote, that the gas for heat and electricity is treated as separate, but probably represents, at least in part, increased efficiency in the use of the same gas.
Biodegradable waste
Biodegradable waste Bruno Prior Thu, 13/02/2020 - 17:35NG/E&Y potential: 1,042 - 8,328m m3
Credible potential: 0 - 100m m3
The greatest mystery about NG/E&Y’s figures for biodegradable waste is exactly what material they had in mind, and how they expected it to be used. The main biodegradable components of municipal and commercial wastes are food wastes. But these are considered separately.[1]
Other technically-biodegradable components of the waste stream include garden waste, paper, card and wood. None of these is very suitable for digestion. Wood waste is also considered separately, but for wont of an alternative explanation, the rest must be the core of what NG/E&Y had in mind for this category.
Garden waste was and continues to be composted primarily. There is an established infrastructure and market for this product. It is unsuitable for digestion, because of the amount of fibre/lignin/non-putrescibles. It could be suitable for gasification (see below) if suitably prepared, but it is doubtful that the challenge is worth the reward compared to the straightforward and commercial option of composting. Were it diverted from composting, then there would be a danger of the market resorting to less environmentally-friendly options such as peat.
Paper and card are also not suitable for digestion, at least without significant technological breakthroughs that were not in prospect in 2009 and have not materialised since. They are eminently suitable for thermal processes, and form (along with plastics) the bedrock of the UK’s significant expansion of Energy-from-Waste. They could be gasified instead of incinerated, if the technology were sufficiently mature and competitive (see below). Much of it can also be (and substantially is) recycled.
The recycling rate for paper and cardboard is widely reported to be around 80%.[2] Government statistics provide only partial information, and are structured in such a way that it is difficult to get a complete picture.[3] The real picture appears to be around 7.5m tonnes of paper recovered from around 10.8m tonnes of paper and cardboard consumed.[4]The unrecoverable proportion is thought to be around 22%, which leaves around 970,000 tonnes available for gasification, if it can be recovered and converted to a useful fuel economically, without diverting material from currently-preferred recovery options.
The recycling rate for paper and card was already high by 2009.[5] And total volumes were higher, as the cyclical and structural declines in paper consumption had only just begun. However, over half of the recovered material was exported, mainly to China. There were problems with demand from both native and foreign recyclers.[6] NG/E&Y might reasonably have assumed that most of the exported, some of the native-recovered and some of the unrecovered material could be available for gasification – perhaps as much as 5-6m tonnes. This would have turned out to be much too optimistic, but the availability of feedstock is anyway one of the lesser problems with this option to increase the volumes of green gas (see below).
[1] It is possible that their “food waste” referred only to commercial food waste, and their “biodegradable waste” is short for Biodegradable Municipal Waste, including municipal food waste. But they do not describe them as so, and their figures for food waste would be even less explicable if they excluded the municipal component. It would, however, help to explain the largely inexplicable figures for biodegradable waste, though not remotely enough to make 8,328m m3 a possibility.
[3] For example, the Let’s Recycle report relied, like many on DEFRA’s, UK Statistics on Waste, Mar 2019 https://assets.publishing.service.gov.uk/government/uploads/system/uploads/attachment_data/file/784263/UK_Statistics_on_Waste_statistical_notice_March_2019_rev_FINAL.pdf. This reports that, of 4,749,000 tonnes of waste paper and cardboard produced in 2017, 3,754,000 was recycled/recovered. Paper and card would also have been a substantial proportion of the 700,000 tonnes that went to Energy-from-Waste. However, this appears to be the subset of paper that is used for packaging, within a report that is focused on household waste.
[4] 7.5m tonnes from https://paper.org.uk/the-paper-industry/key-statistics/. 10.8m tonnes is from the CPI’s most recent annual report, for 2017/18 (https://paper.org.uk/PDF/Public/Publications/Annual%20Reviews/CPI%20Annual%20Review%202018.pdf). The CPI do not seem to have published a more recent report. 22% unrecoverable is from the same source. The figures for total consumption appear to include an extra category (transit packaging) compared to the figures below for pre-2010. We can compare, for instance, the figures for 2010 consumption: 13m tonnes according to CPI’s 2017/18 annual report, but 10.7m tonnes according to their 2012/13 annual report. Without transit packaging, UK consumption of paper and board is probably around 9.5m tonnes.
[5] Government data is hard to find for the years before 2010. The archived spreadsheet at https://webarchive.nationalarchives.gov.uk/20100403161511/http://www.defra.gov.uk/evidence/statistics/environment/waste/wrpaper.htmindicates a recycling rate of 71% in 2007 (8.6m tonnes recovered vs 12.1m consumed), rising rapidly from 65% in 2006 and 50% in 2003. The Confederation of Paper Industry’s annual report for 2012/13 suggests the rate was closer to 80% by 2009, largely because consumption (10.3m tonnes) had fallen faster than recovered material (8.1m tonnes) because of the Crash and increasing use of electronic media. (https://paper.org.uk/PDF/Public/Publications/Annual%20Reviews/CPI%20Review%202012-13.pdf). Comparing recovery with consumption over-states the amount of residual paper available for other uses, as not all paper that was consumed would appear in the waste stream (e.g. if burnt on-premises). Around 20% of paper and card is thought to be unrecoverable.
Gasification (wood waste, miscanthus, etc.)
Gasification (wood waste, miscanthus, etc.) Bruno Prior Thu, 13/02/2020 - 17:39NG/E&Y potential: 3,098 - 6,668m m3
Credible potential: 0 - 3,700m m3
Of the waste streams listed by NG/E&Y, at least two – wood waste and miscanthus – must have been envisaged as feedstock primarily for gasification, not digestion. As explained above, we should probably add (despite its name) the biodegradable waste, as effectively the paper and card waste stream.
Of approximately 4.5m tonnes of waste wood produced in the UK, around 2.1m tonnes is currently going to biomass energy projects.[1] 1.35m tonnes is reused and 0.3m tonnes is exported.
The total amount of waste wood was not dissimilar in 2009.[2] The majority was from construction and demolition waste, which introduces challenges of identifying and handling the treated wood. WRAP estimated that only around 1.4m tonnes was “clean solid wood”.
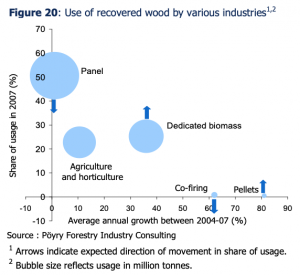
WRAP seem to indicate that almost all of it was already being recovered, driven primarily by the wood panel industry.[3] Nevertheless, WRAP expected recovery to increase overall, and energy-use to increase (driven by the RO, i.e. for electricity generation) while panel manufacturers’ share fell.[4]
Barring the complete implosion of British panelboard manufacturing, it was reasonable for NG/E&Y to assume that a material proportion of the clean waste wood would continue to go to this use. Likewise, animal bedding and other existing forms of re-use.
Around 2m tonnes of waste wood available for energy-use, seems to be a recurring figure from the studies, which would have been a reasonable top-end figure for gasification assuming it displaced all other energy-uses. It is also consistent with what happened in practice under the incentives of the RO and RHI, although of course it went almost entirely to mature combustion technologies and not to gasification.
We set out below what might be credible if the UK made ambitious efforts to produce energy crops for digestion. The constraining figures are the same for gasification feedstocks. The same amount of land is available, and the uses are mutually exclusive.
A key difference is that the technology for digestion is mature. We might therefore prioritise energy-crop land-use for digestion rather than gasification. Nevertheless, not all land is equally suitable for all crops, so there might well be a mix. Some proportion of the figure estimated below for energy crops might have been available for gasification instead of digestion. In practice, 7,000 ha produced around 71,000 odt of miscanthus in 2018.[5]
So we have a maximum potential gasification feedstock of around 5-6 million tonnes of paper and cardboard, 2 million tonnes of waste wood, and perhaps 6 million tonnes of energy crops.[6] That’s around 63 TWh of feedstock (which does not mean 63 TWh of potential biomethane, because of conversion efficiencies, as below). Around 27 TWh of that is mutually exclusive with the upper estimate for digestion energy crops.
The true problem for gasification starts when we consider how this would be used. Gasification technology is in one sense very mature. It has been known and used for decades.[7] But in another sense, it is still immature. Despite many attempts in recent decades to commercialise it, no offering has succeeded to any significant extent.
One problem relevant to this report is the nature of the feedstock. Gasification was only ever deployed at scale for the conversion of coal, which is a homogeneous fuel. Recent efforts have focused on more heterogeneous feedstocks, such as waste. But the process needs very precise control of energy-feed-rate, air, etc. Many gasification projects have foundered on the front-end.
Another major problem for these purposes is that gasification does not produce biomethane. It produces a mixture of methane (CH4), carbon monoxide (CO) and hydrogen (H2), to name the three main combustible elements of the gaseous product. In the days of town gas, this mixture was permitted in the gas network. Nowadays, there is a very tight specification for the gas that can be accepted into the network: largely methane with a small amount of more-complex alkanes. For operational and safety reasons, gasification gas could no longer be added to the gas network. So one immature technology (gasification) would have to be complemented by an even less mature technology (methanation) to convert the gasification gas into a gas that could be distributed to users.
Considerable effort has been invested in recent years in gasification + methanation to produce a Synthetic Natural Gas (SNG). But (a) it is 2020 and none of those are commercially mature, and (b) NG/E&Y could not reasonably have predicted that they would be, given the state of technology and the market in 2009. Decades of efforts around the world had resulted in no commercial options to date. The prudent assumption was that 10 years was not long enough for the problems to be ironed out and the technology commercialised.
Yet NG/E&Y included the following quantities of biogas from gasification in their baseline projection: 1,253m m3 from wood waste, 1,845m m3 from miscanthus, and (probably) 1,042m m3 from biodegradable waste. This constituted 74% of the 5,625m m3 of biogas that they envisaged would be available as a minimum in 2020.
Of all their imprecisions, this is the most egregious. The only reasonable figure to use for this technology in the baseline scenario was zero. Decades of effort had so far delivered almost nothing. And sure enough, from the perspective of 2020, we find that the most recent decade also produced almost no commercial SNG production, not just in the UK, but globally.
As for the “stretch” scenario, how much biogas might those 63 TWh of feedstock have produced? The conversion efficiencies of gasification and methanation are both typically estimated at around 80%, so we will assume the combined efficiency would be 64%. That implies a maximum of around 40 TWh of biomethane from this source.
At 10.83 kWh/m3 of methane, that’s around 3.7bn m3 of biomethane. NG/E&Y had 2,697m m3 from wood waste, 3,971m m3 from miscanthus, and 8,328m m3 from biodegradable waste (probably). This technology now accounted for 81% of the total 18,432m m3 of biomethane anticipated in the “stretch” scenario.
In other words, gasification and these feedstocks, were NG/E&Y’s deus ex machina to convert what was obviously an inadequate potential of digester gas, to an apparently-significant potential of biomethane. Unfortunately, it was not just a misestimation; it was a fiction with no basis for reasonable expectation given the knowledge available at the time.
[2] WRAP, Wood waste market in the UK (2009), https://www.wrap.org.uk/sites/files/wrap/Wood%20waste%20market%20in%20t…
[3] “In 2007, just over half of wood waste was used by panel manufacturers. Dedicated biomass energy generators used a quarter; agricultural or horticulture product manufacturers used a fifth; and pellet producers and co-firing energy generators the remainder.” Although this refers to wood waste as a whole, one suspects they were referring to shares of the proportion that was recovered.
[4] One way to make sense of the figures is that WRAP’s figures referred to the recovered quantities of waste wood, although that seems to conflict with the fact that the majority of their 4.5m tonnes was hard-to-recover construction and demolition waste. But perhaps the relatively-low figures for those components reflected the fact that they were the recoverable element. In an earlier analysis, WRAP had put the figure significantly higher at around 10.6m tonnes of waste wood in total (DEFRA, Waste Wood as a Biomass Fuel, 2008, https://www.forestresearch.gov.uk/documents/2078/DEFRA_Waste_wood_as_a_biomass_fuel_2008.pdf). WRAP’s 2009 report also noted that volumes were in decline because of the Crash and its impact on panelboard manufacturers and others, and that their tonnages for construction and demolition waste might be incomplete. But they also noted that theirs was a more detailed study. The true figure is presumably somewhere between 4.5m and 10.5m tonnes. Despite the higher total, the 2008 report nevertheless envisaged an ambition of around 2m tonnes for energy-use.
[6] 6m tonnes of energy crops is calculated on the basis that 2.5bn m3 of biogas is around 27 TWh, which is around 6m tonnes of low-moisture wood (at 4.5MWh/tonne).
[7] Coal gasification was the source of the town gas used in the UK before natural gas displaced it during the 60s. It was an essential part of the technology used by the Germans during the War to convert their plentiful reserves of coal to compensate for their inadequate supplies of petroleum.
Energy crops for digestion
Energy crops for digestion Bruno Prior Thu, 13/02/2020 - 20:22NG/E&Y potential: N/A
Credible potential: 250 - 2,500m m3
Ernst & Young considered only “a possible limited contribution from sustainable energy crops” for gasification (none for digestion), even though Enviros had relied heavily on it in their most ambitious scenario for the potential of biogas.[1] The “food vs fuel” debate was a hot topic, and E&Y no doubt judged that it would raise political resistance to rely on energy crops.[2]
In practice (and in theory to most analysts, then and now, other than E&Y), energy crops are the only way to expand biogas production beyond the limited potential of waste resources. But there is a practical limit even to the grandest ambitions.
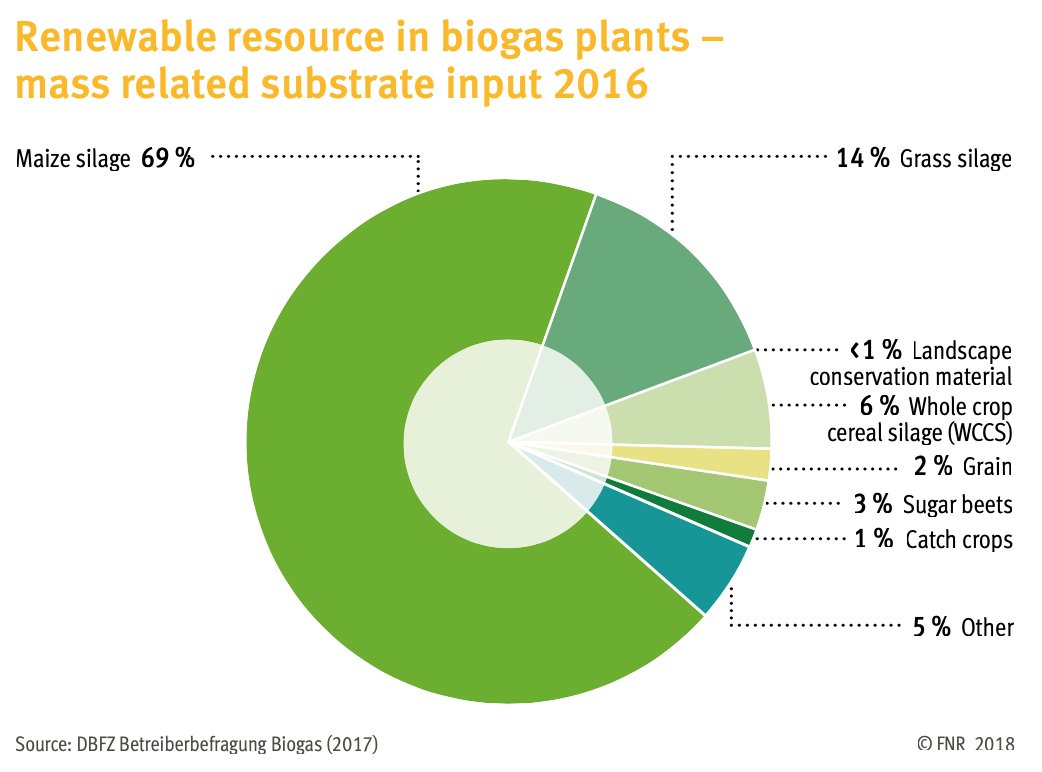
Germany has made by far the largest effort to develop biogas.[3] It has relied heavily on energy crops to do so.[4]
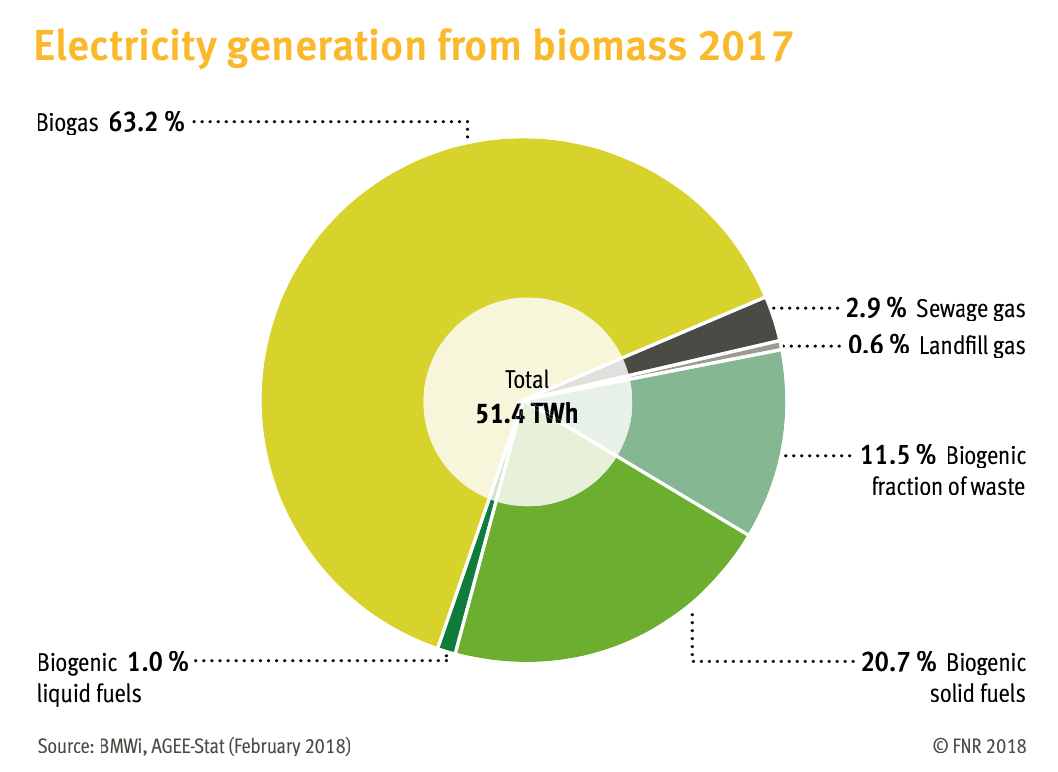
Germany has devoted 14% of its agricultural land (2.35m ha, 8% of its undeveloped land) to energy crops. Of this, nearly 60% (1.37m ha) is for biogas feedstocks. Yet biogas represents 2.2% of Germany’s primary energy consumption.[5] Biogas represents around 5% of Germany’s electricity and around 1.4% of its heat, and an insignificant proportion of their transport fuels.[6]
Germany illustrates the competition for land where significant reliance is placed on energy crops. Most of the rest of the energy-crop land (964,000 ha) is for the production of liquid fuels (biodiesel and bioethanol). Liquid fuels are hard to replace in some uses, such as aviation fuel. Biofuels are not currently used much for aviation in Germany (or elsewhere). They represent 4.7% of the fuel consumption for land transport.[7] If used for aviation, this volume would represent around 24% of Germany’s requirements.[8]
Nearly one-third of Germany’s land is forested, compared with 13% of the UK’s land. The Germans have utilised solid biomass (primarily wood) to a greater extent than the UK. The Germans do not waste so much of this resource as the UK generating electricity at around 35% conversion efficiency. Most of it is used to produce heat (direct or as CHP) at around 80% efficiency.[9]
|
|
Germany |
UK |
|
Total land area (k ha) |
35,700 |
24,400 |
|
Woodland area (k ha) |
11,400 |
3,200 |
|
Agricultural land area (k ha) |
16,700 |
17,500 |
|
Energy crops area (k ha) |
2,350 |
94 |
|
Area for AD feedstocks (k ha) |
1,374 |
57 |
|
Area for biofuel feedstocks (k ha) |
964 |
27 |
|
Area for solid energy crops (k ha) |
11 |
10 |
|
Primary energy consumption (TWh) |
3,469 |
2,056 |
|
Total gas consumption (TWh) |
937 |
880 |
|
Household energy consum. (TWh) |
658 |
431 |
|
Household gas consumption (TWh) |
279 |
309 |
|
Heat from solid biomass (TWh)[10] |
107 |
44 |
|
Heat from biogas (TWh)[11] |
17.2 |
4.6 |
|
Liquid biofuels (TWh)[12] |
31.5 |
5.9 |
The UK has a lot less land than Germany dedicated to the production of solid fuels (e.g. wood), liquid fuels (biodiesel/ethanol) and gaseous fuels (biogas). If we focused on expanding one aspect (e.g. energy crops for biogas), we would miss the contributions of the other types of energy. And all of them compete with the traditional use of agricultural land for food production.
Enviros envisaged the use of 157,000 ha for the production of energy crops for AD in their most ambitious scenario. Ernst & Young discounted the possibility altogether.
94,000 ha are used to grow energy crops in the UK, out of a total utilised agricultural area of 17.5m ha.[13] We have 3.19m ha of woodland.[14] Our total land area is 24.4m ha.
Germany has 2.35m ha growing energy crops (out of 16.7m ha of agricultural land) and 11.4m ha of forest, out of a total land area of 35.7m ha. Yet Germany meets only a small proportion of its energy requirements from these fuels. Is there (and was there ever) a credible model for the UK to produce a material proportion of its energy requirements from a smaller area of land? And if not, what is the model for biogas to make a material contribution to the UK’s energy supplies, given that it can only be stretched to Germany’s modest contribution through orders of magnitude higher use of land for energy production than we currently deploy?
Let’s imagine that the UK increased the level of energy crop production to the same as Germany. 14% of UK agricultural land = 2.45m ha. 58% of this (1.43m ha) is used to produce AD feedstocks, while 41% (1m ha) is used to produce liquid biofuels. The German experience suggests around 45MWh/ha p.a. for biogas from energy crops.[15] We could produce 64.35 TWh of biogas, i.e. around 5.9bn m3. That represents around 17% of domestic gas consumption or 6% of total gas demand, according to Ernst & Young’s projections. In practice, gas consumption has fallen somewhat, and this amount would represent 21% of domestic gas consumption and 7% of total gas demand.
We need additionally to allow for the reforestation that is (a) part of this government’s policy, and (b) required to match the German model. To bring us up to German levels of afforestation, we will need to switch another 4.6m ha from agricultural use to forestry. Our agricultural land area would be reduced from 17.5m ha to 10.5m ha.
Or we might choose to have less forest than Germany. In that case, we will either have to import more solid biomass fuels, or use less solid-biomass heat, which currently makes up approximately two-thirds of Germany’s renewable heat.
For reasons of climate policy, the UK (like many countries around the world) plans to increase significantly its forested area. Without deforestation or a substantial reduction in agricultural production, the potential for energy crops in the UK will have to be kept within reasonable bounds that constrain the potential of digestion or other conversion technologies.
[1] See above: 157,000 ha of land for energy-crop production, contributing to total biogas production equal to <4% of total heat demand.
[2] e.g. David J Tenenbaum, “Food vs. Fuel: Diversion of Crops Could Cause More Hunger”, Environ Health Prospect, Jun 2008. https://www.ncbi.nlm.nih.gov/pmc/articles/PMC2430252/
[3] Bioenergy Europe, Statistical Report 2019, Biogas section Table 2
[4] Fachagentur Nachwachsende Rohstoffe, Bioenergy in Germany, Facts & Figures 2019, http://www.fnr.de/fileadmin/allgemein/pdf/broschueren/broschuere_basisdaten_bioenergie_2018_engl_web_neu.pdf
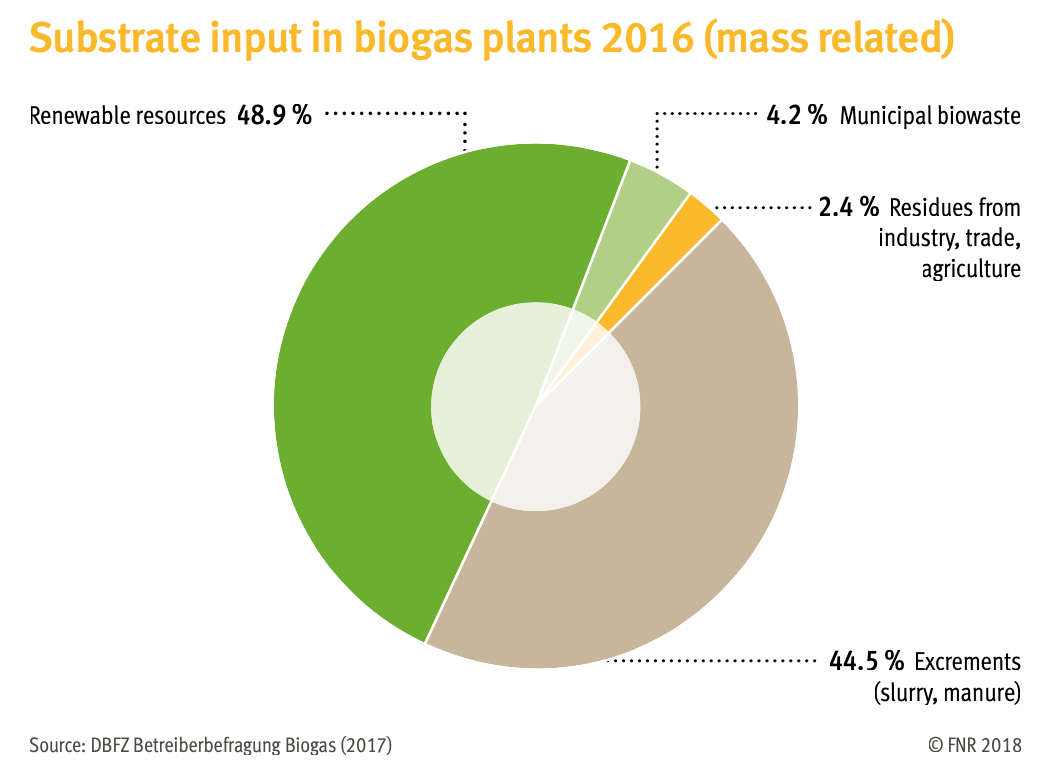
Given the different gas potential of energy crops and excrements, this means that energy crops are responsible for around two-thirds of Germany’s biogas.
[5] Bioenergy in Germany, Facts & Figures, p.39: used share of biogas primary energy potential: 273 PJ = 75.8 TWh. Eurostat, T2020_33, Primary energy consumption. Germany (2017): 298.31 ktoe = 3,469 TWh https://ec.europa.eu/eurostat/databrowser/view/t2020_33/default/table?lang=en
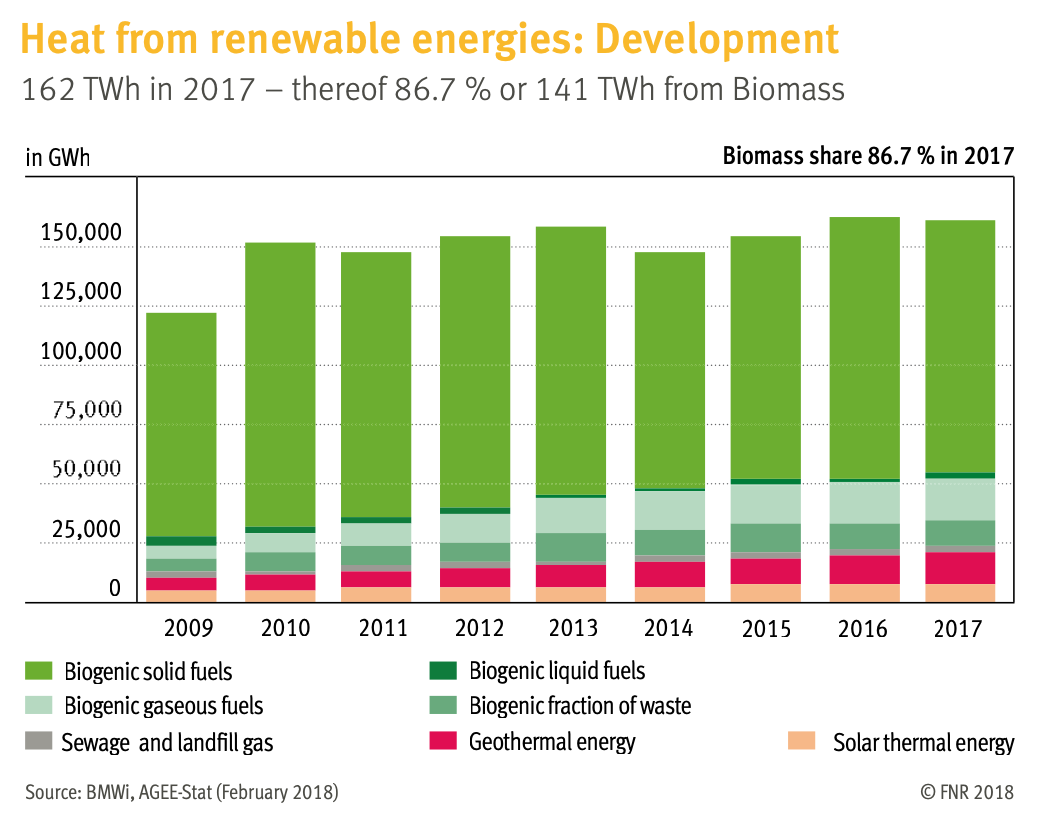
[6] Data from Bioenergy in Germany, Facts & Figures 2019. Gross electricity generation: 654.8 TWh. Electricity generation from biogas: 63.2% of 51.4 = 32.5 TWh. Renewable heat (162.2 TWh) share of final energy consumption for heat: 12.9%. Biogas share of renewable heat: 10.6%
[7] ibid. p.28. Total land transport fuel consumption: 57.6 Mtoe = 670 TWh. ∴ Biofuels = 31.5 TWh
[8] Germany’s jet fuel consumption 2018: 221,010 barrels of oil per day = 131.3 TWh p.a. https://www.theglobaleconomy.com/Germany/jet_fuel_consumption/
[9] ibid. pp.5-6.
[10] Excludes biogenic fraction of waste. UK figure based on DUKES 6.1.1 depends on highly-suspect estimates of domestic wood burning. Reality is probably roughly half.
[11] Excludes sewage gas and landfill gas
[12] UK: 599m litres @ 9.8 kWh/litre. Germany: 4.7% of 57.6m toe total land transport fuel consumption.
[13] 27,000 ha are for liquid biofuels. 57,000 ha are for AD (primarily maize). 10,000 ha are for solid biomass. https://assets.publishing.service.gov.uk/government/uploads/system/uploads/attachment_data/file/856695/nonfood-statsnotice2018-08jan20.pdf
https://assets.publishing.service.gov.uk/government/uploads/system/uploads/attachment_data/file/747210/structure-jun2018prov-UK-11oct18.pdf
[14] https://www.forestresearch.gov.uk/tools-and-resources/statistics/statistics-by-topic/woodland-statistics/
[15] This assumes mostly the highest-yielding crop – maize silage – is grown, but some land is not suitable and requires lower-yielding crops.
