3.4 Sensitivities
3.4 Sensitivities Bruno Prior Tue, 15/12/2020 - 11:523.4.1 Random temporal variation
- Regardless of climate change, the weather changes randomly (effectively) from year to year. That affects not only temperatures, but also the profile and average intensity of wind and insolation. To a lesser extent, there are also small differences in human aggregate behaviour. To test this, we can check how this scenario would look under the conditions that pertained in 2016 and 2018 (our base scenario used 2017 conditions). All three years were slightly milder than average, but not exceptionally mild. They are adequate (and must be, given the constraints on the availability of real-world data) to test variations primarily in the timing rather than in the normality of the weather.
- Even with neighbouring years, there are some differences that make the data not perfectly comparable. In particular, wind and solar were being rolled out apace in this period. A fair amount of it was embedded. That means that embedded renewables had a bigger impact on electricity demand data in 2018 than in 2016. We use the demand data to estimate the profile rather than the amplitude, so it does not affect the totals. But embedded intermittents will have somewhat increased the apparent variations in demand in 2018 compared to 2016.
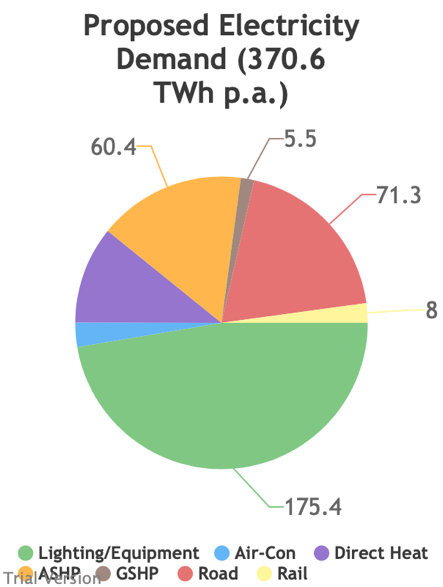
- As one would expect in years of non-exceptional weather, the temporal variation did not make much difference to the modelled aggregate electricity demand.
| 2016 | 2017 | 2018 |
|---|---|---|
|
Image
|
Image

|
Image

|
- The variation in the demand profile is not easy to spot without the supply side to compare with it.
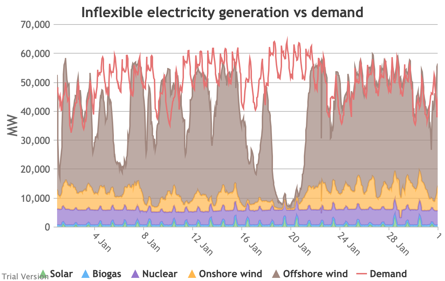
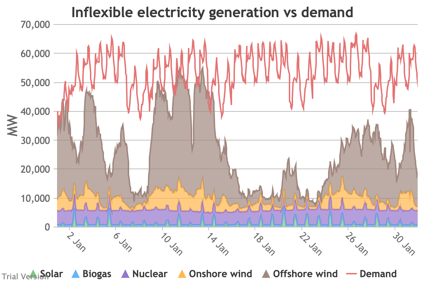
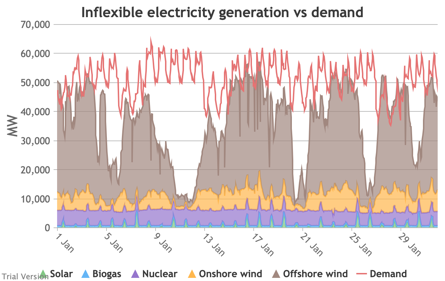
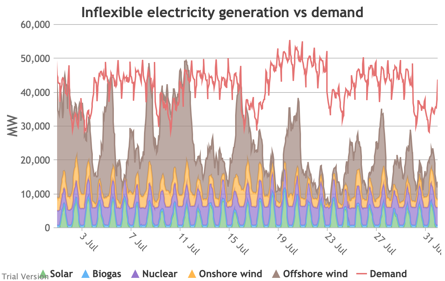
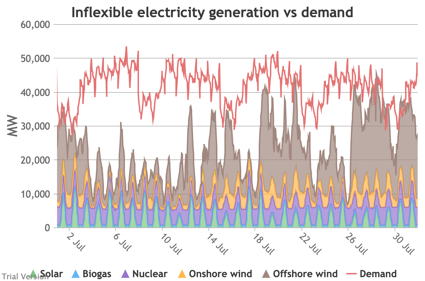
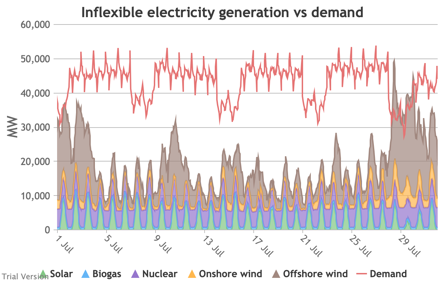
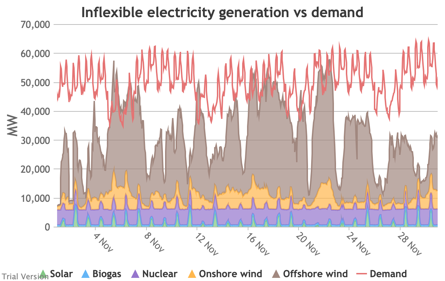
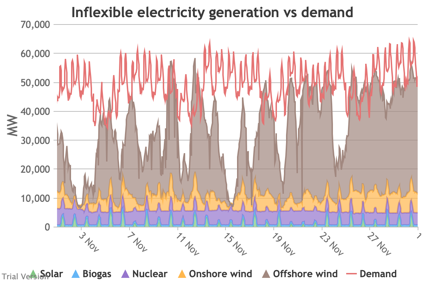
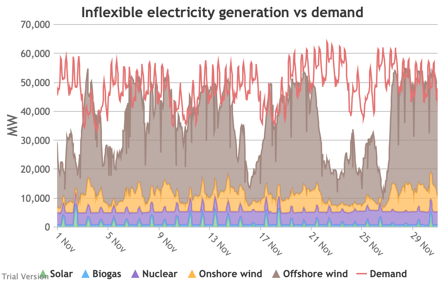
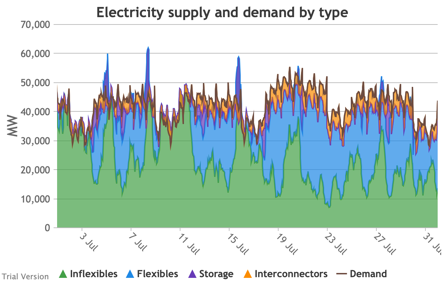
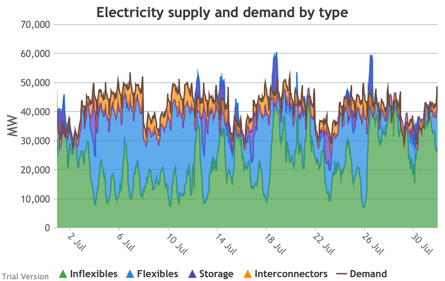
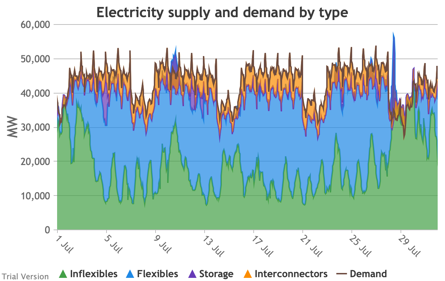
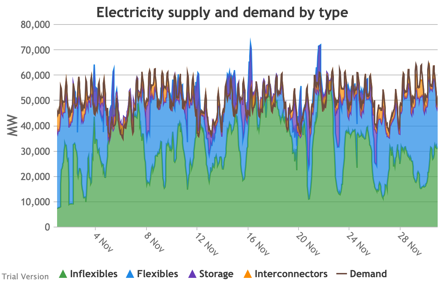
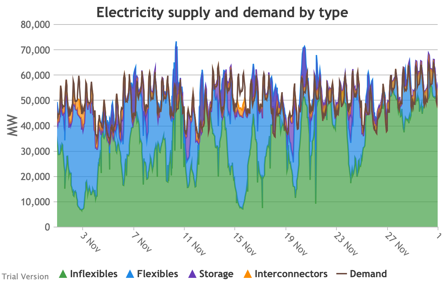
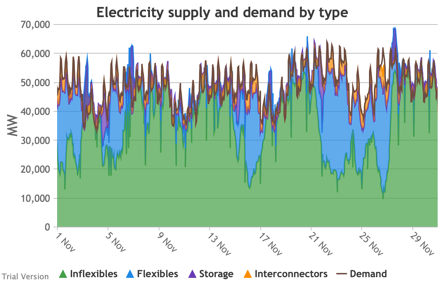
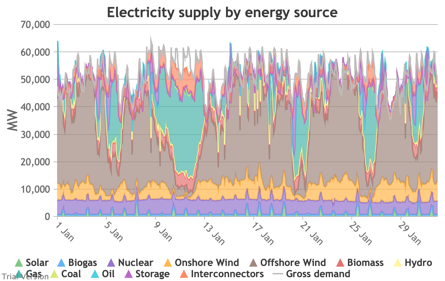
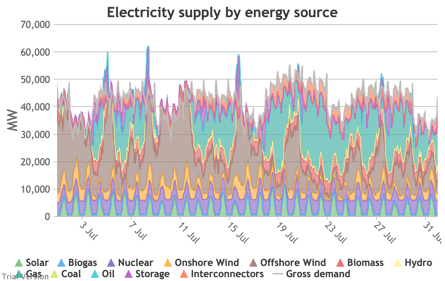
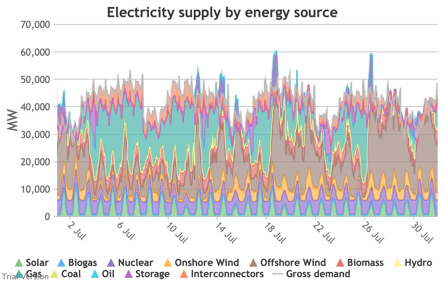
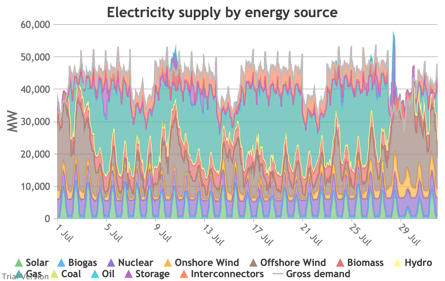
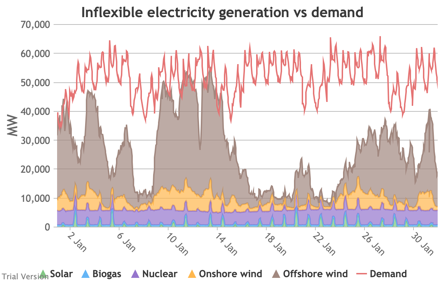
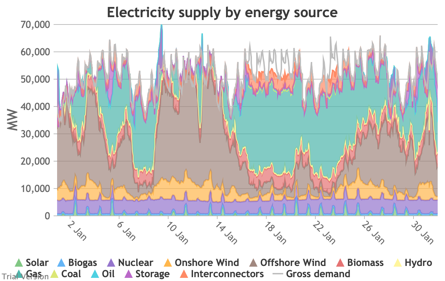
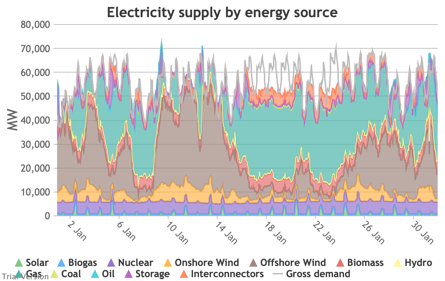
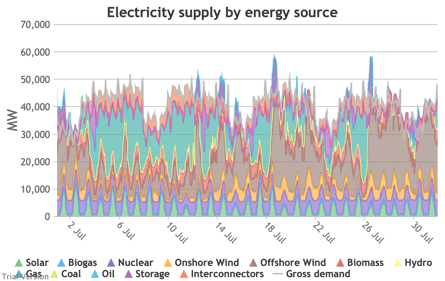
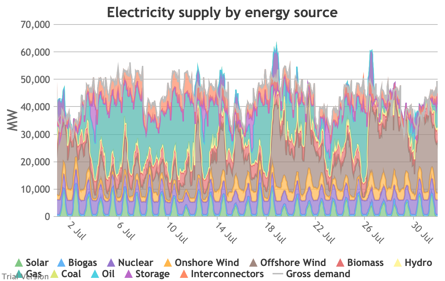
- The comparison of inflexible generation with wholesale demand shows more variation.
| 2016 | 2017 | 2018 |
|---|---|---|
|
Image
|
Image
|
Image
|
|
Image
|
Image
|
Image
|
|
Image
|
Image
|
Image
|
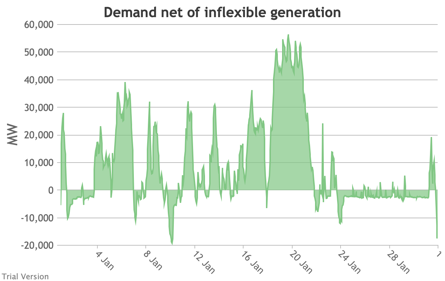
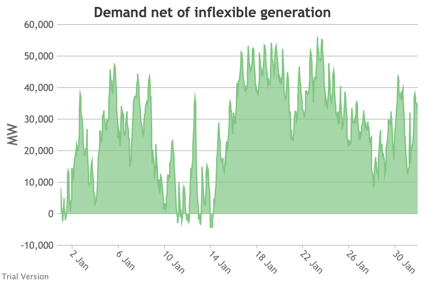
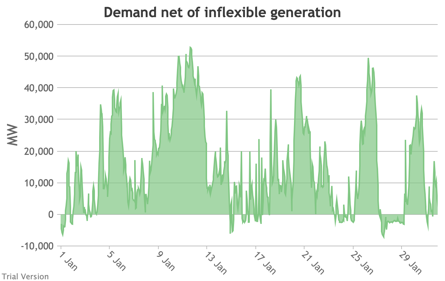
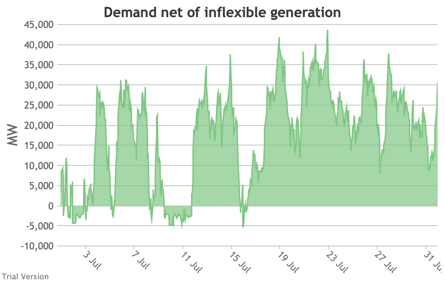
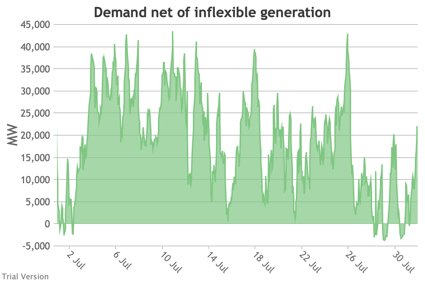
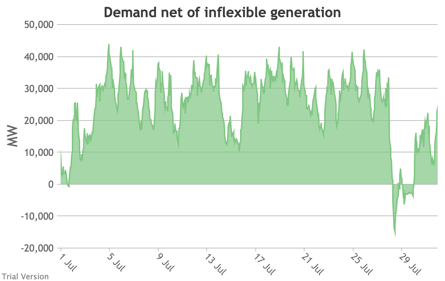
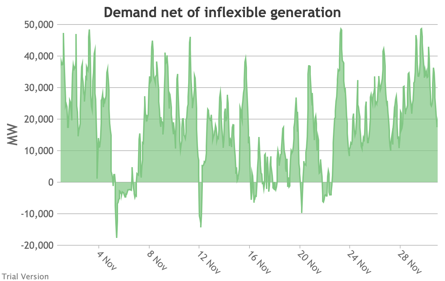
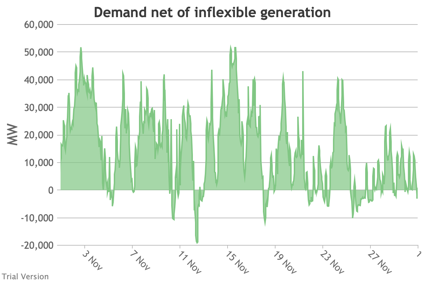
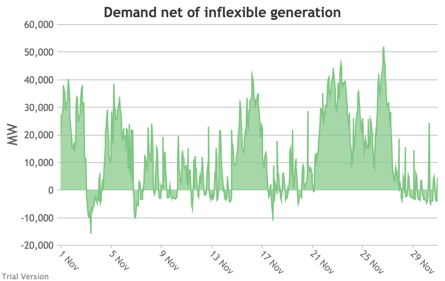
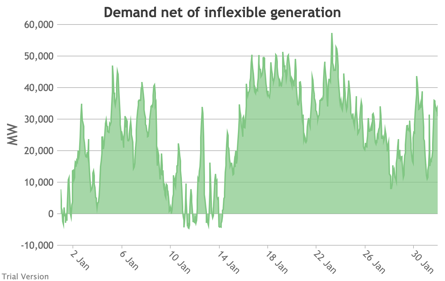
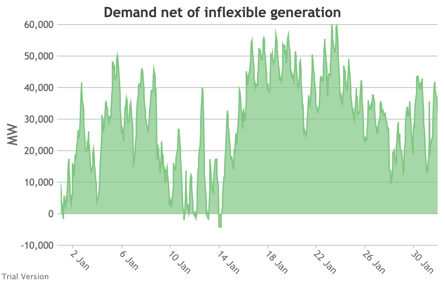
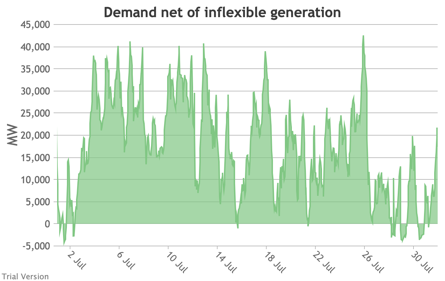
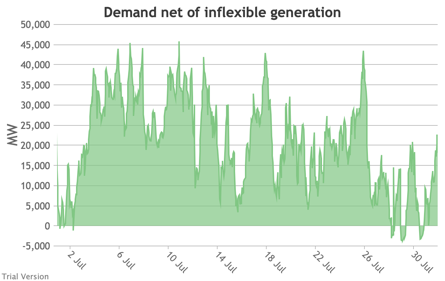
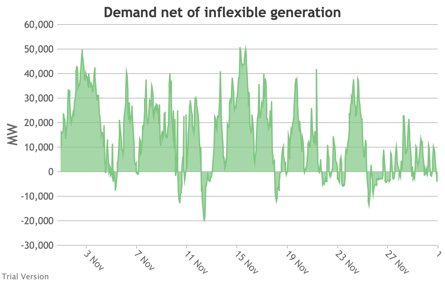
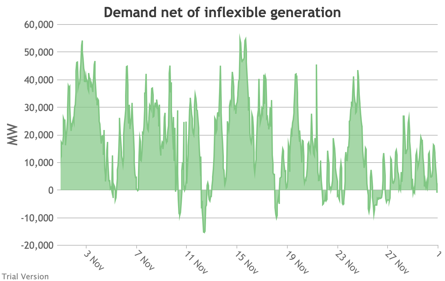
- That translates into significant variation in the demand net of inflexibles.
| 2016 | 2017 | 2018 |
|---|---|---|
|
Image
|
Image
|
Image
|
|
Image
|
Image
|
Image
|
|
Image
|
Image
|
Image
|
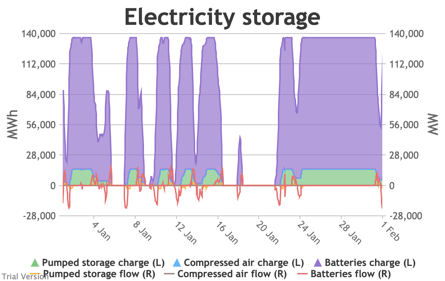
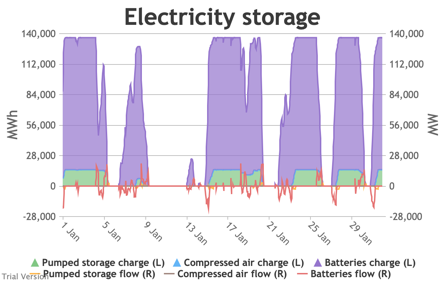
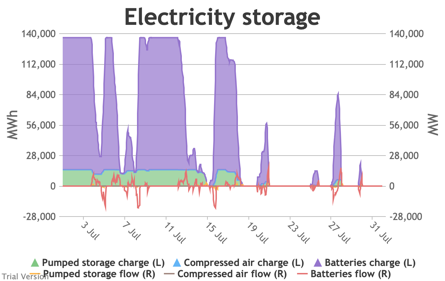
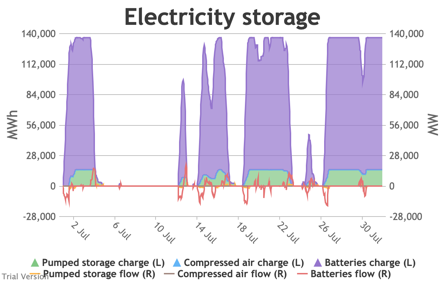
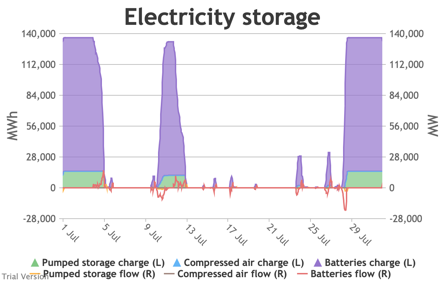
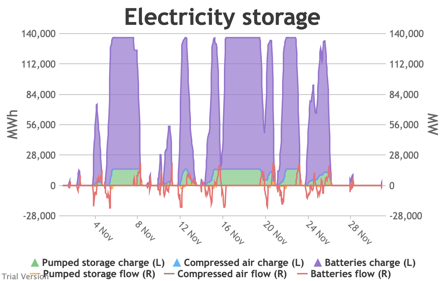
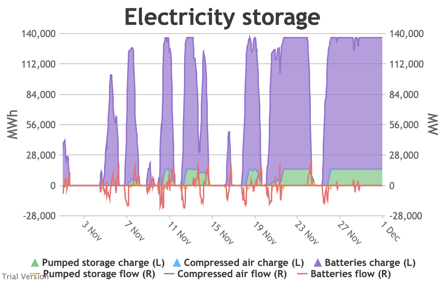
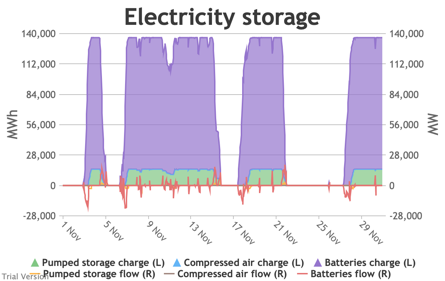
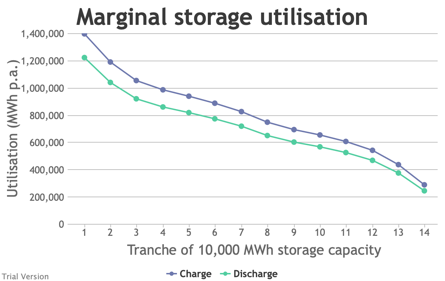
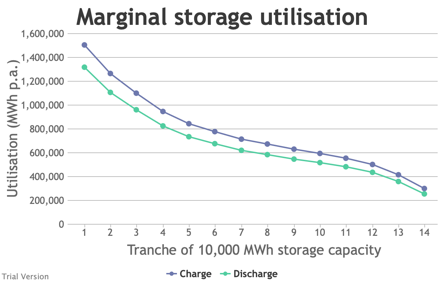
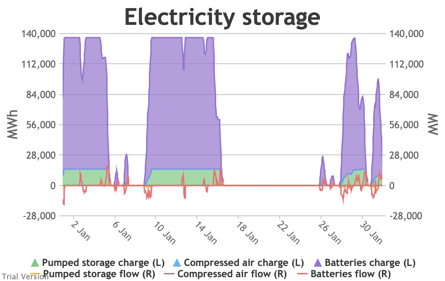
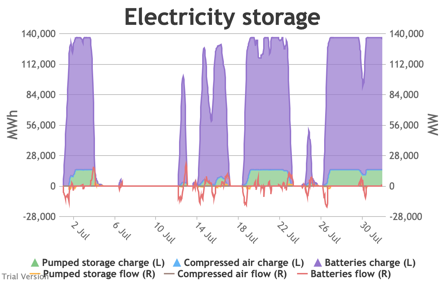
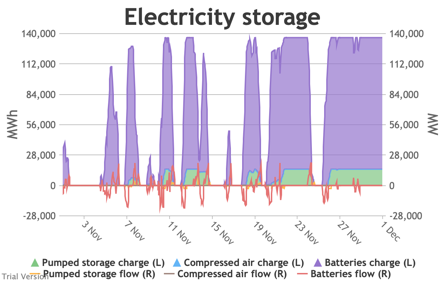
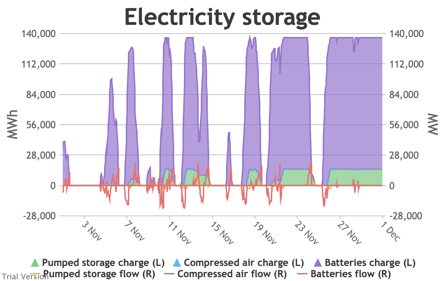
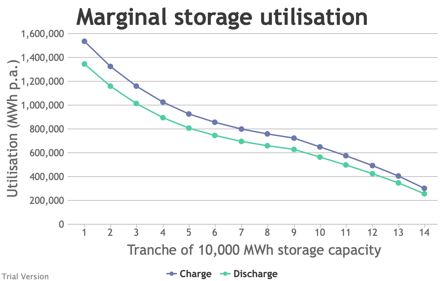
- That puts different strains on the storage capacity, and on its marginal use.
| 2016 | 2017 | 2018 |
|---|---|---|
|
Image
|
Image

|
Image
|
|
Image
|
Image
|
Image
|
|
Image
|
Image
|
Image
|
|
Image
|
Image

|
Image
|
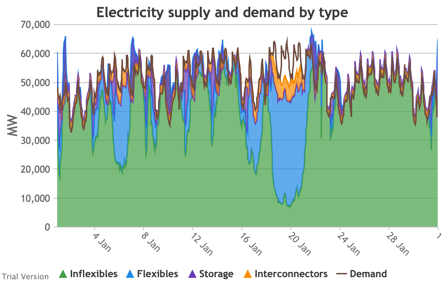
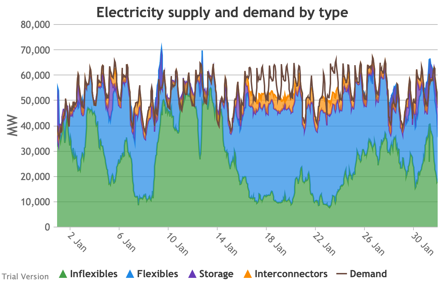
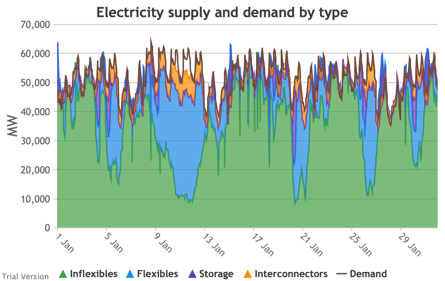
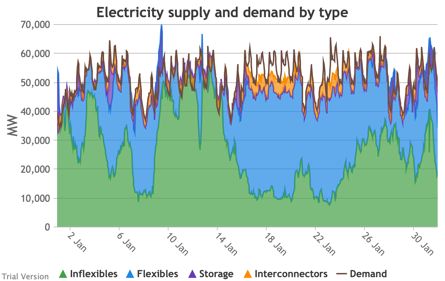
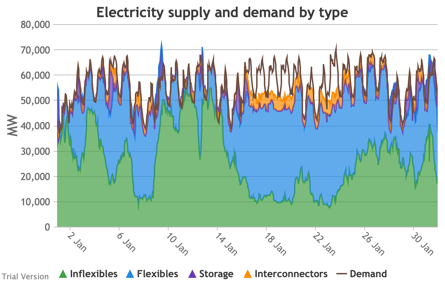
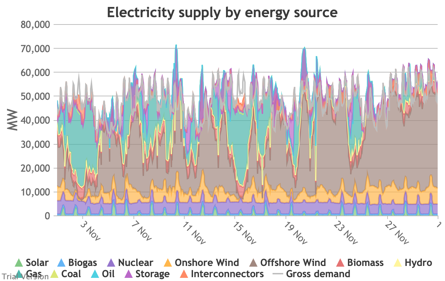
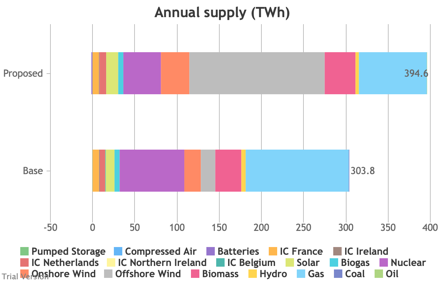
- Interconnector flows also have to vary. The net effect on supply by type is:
| 2016 | 2017 | 2018 |
|---|---|---|
|
Image
|
Image
|
Image
|
|
Image
|
Image
|
Image
|
|
Image
|
Image
|
Image
|
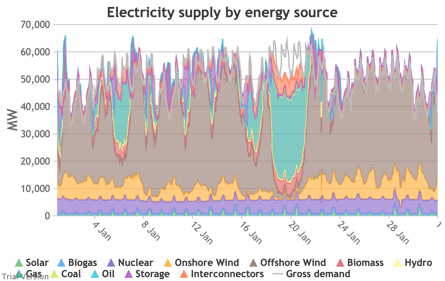
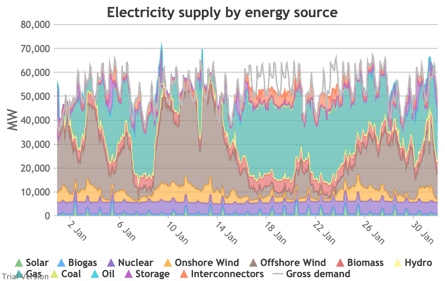
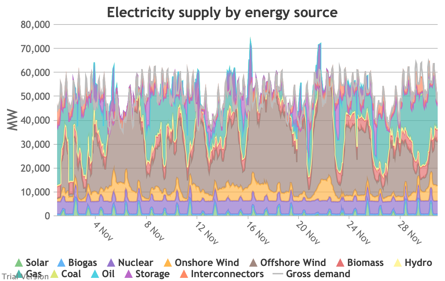
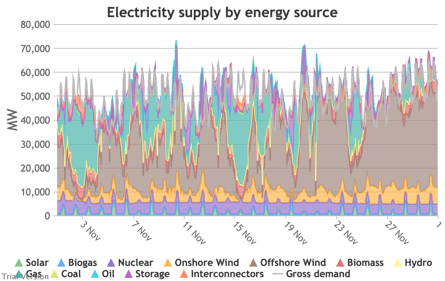
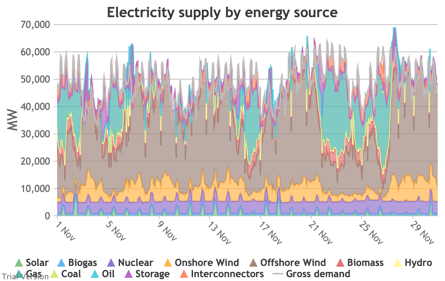
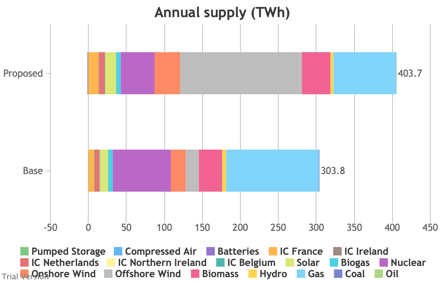
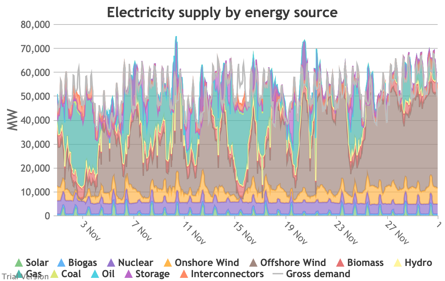
- Likewise, the net effect on supply by source (i.e. technology) is:
| 2016 | 2017 | 2018 |
|---|---|---|
|
Image
|
Image
|
Image
|
|
Image
|
Image
|
Image
|
|
Image
|
Image
|
Image
|
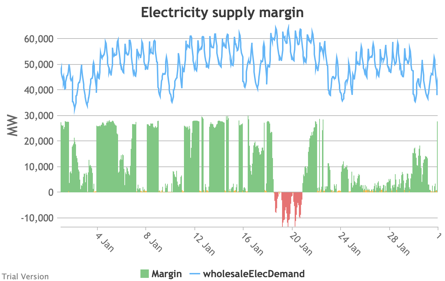
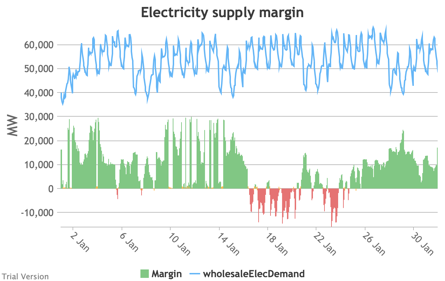
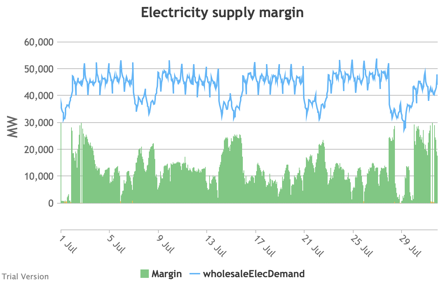
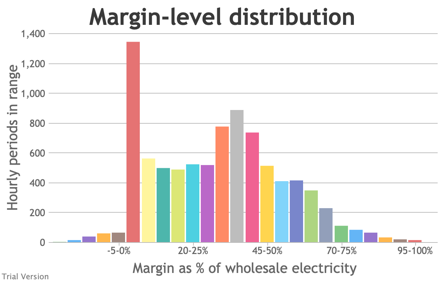
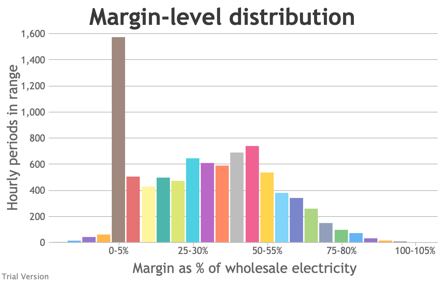
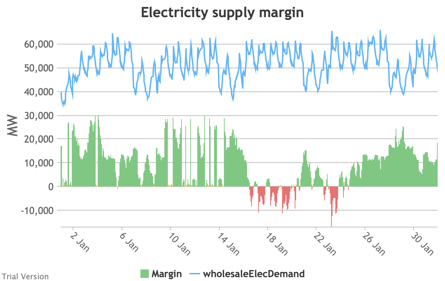
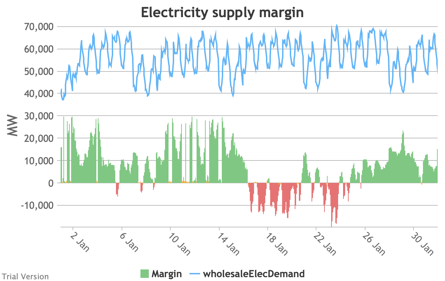
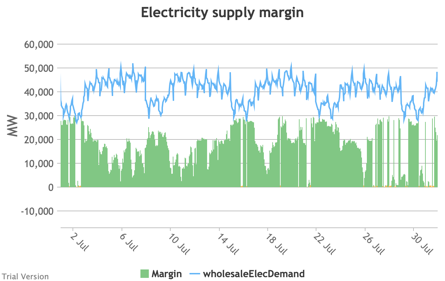
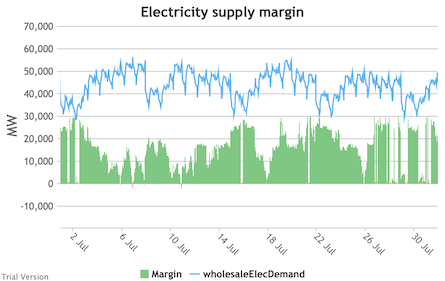
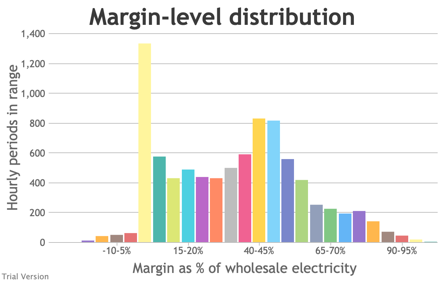
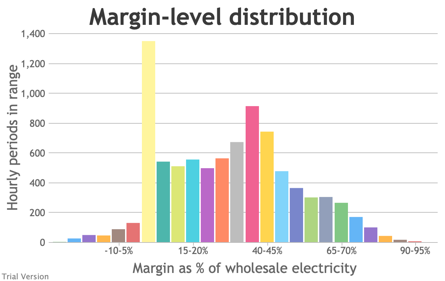
- That feeds through to the electricity supply margin.
| 2016 | 2017 | 2018 |
|---|---|---|
|
Image
|
Image
|
Image
|
|
Image
|
Image
|
Image
|
|
Image
|
Image
|
Image
|
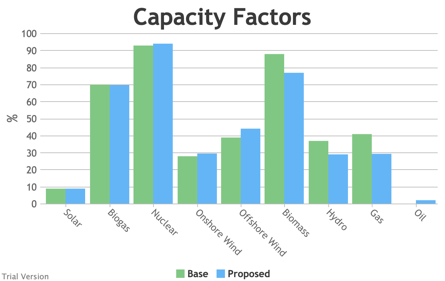
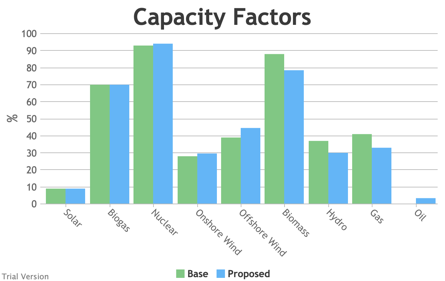
- This adds up to small differences in aggregate technology utilisation, but material differences at the margins.
| 2016 | 2017 | 2018 |
|---|---|---|
|
Image

|
Image

|
Image
|
|
Image

|
Image
|
Image

|
|
Image
|
Image
|
Image
|
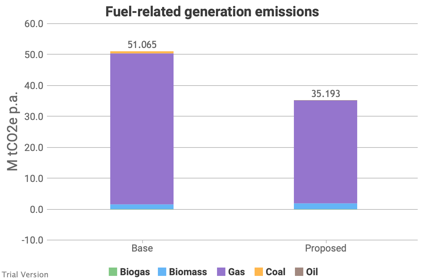
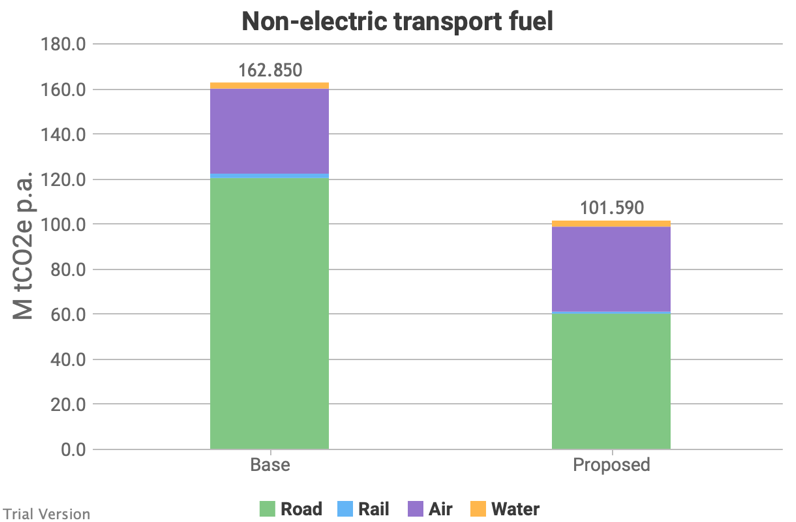
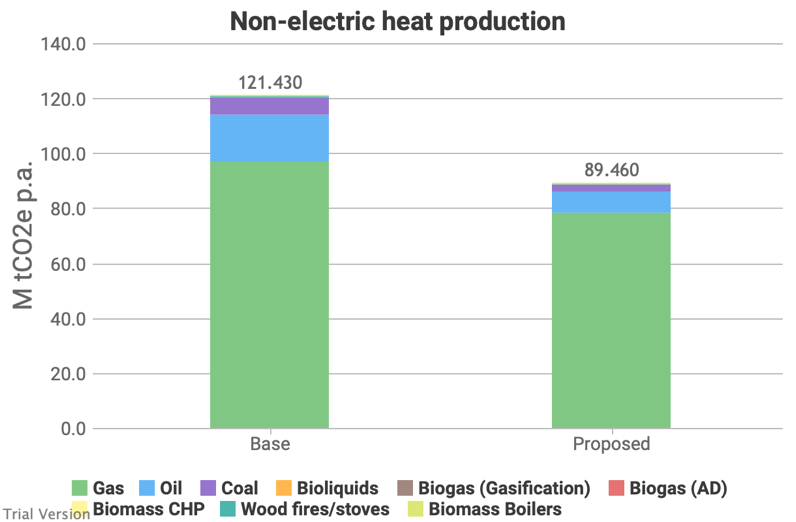
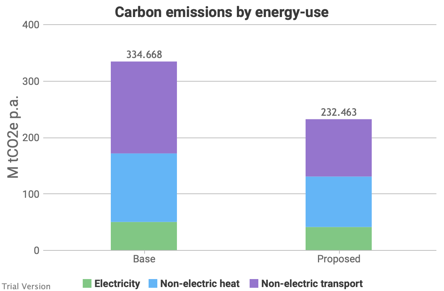
- Because this system still relies on fossil fuels to a significant extent, the carbon footprint of the energy system varies from year to year.
| 2016 | 2017 | 2018 |
|---|---|---|
|
Image
|
Image

|
Image
|
|
Image

|
Image
|
Image
|
|
Image
|
Image
|
Image
|
|
Image
|
Image
|
Image
|
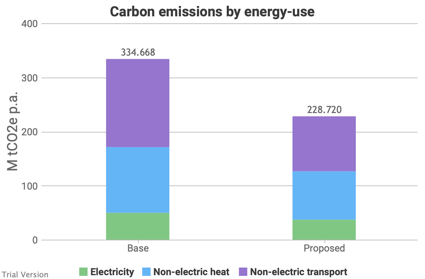
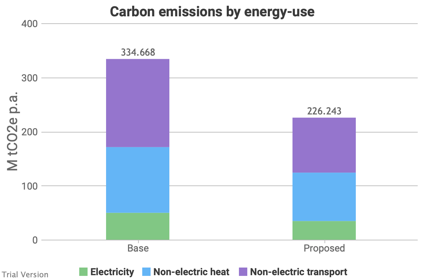
The differences are quite small, because the nature of this comparison is the same spread of technologies and roughly similar levels of aggregate demand in the various uses. The main change in the inputs is the profile, which has a bigger bearing operationally than on the cumulative outcome. In the case of non-electric heat and transport emissions, it’s an artefact of the model design that there is no difference between these projections without a change in the aggregate.
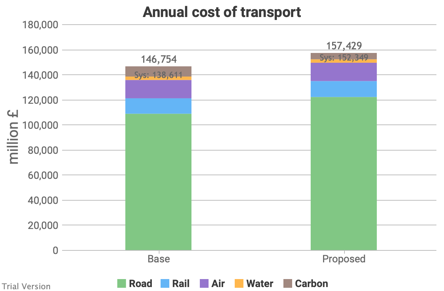
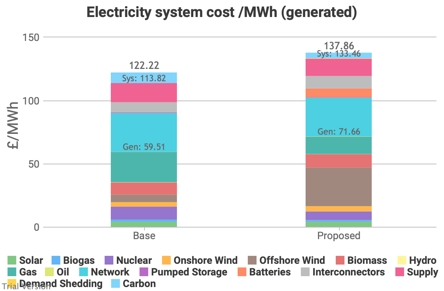
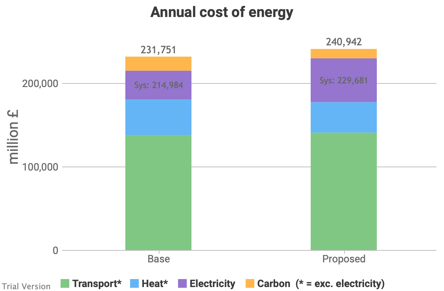
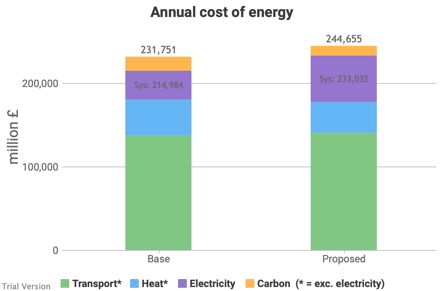
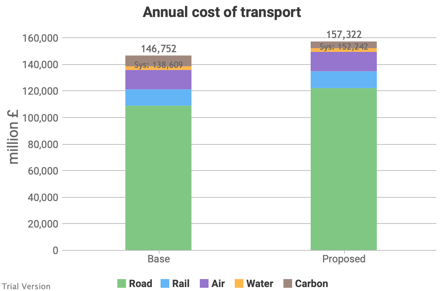
- 3.4.1.13 Costs also vary marginally from year to year depending on the impact of the weather on the profiles of supply and demand.
| 2016 | 2017 | 2018 |
|---|---|---|
|
Image

|
Image

|
Image

|
|
Image
|
Image

|
Image
|
|
Image

|
Image

|
Image
|
|
Image

|
Image

|
Image
|
|
Image

|
Image
|
Image

|
|
Image

|
Image

|
Image
|
These changes are small enough that they are mainly useful as demonstration that the model is recalculating for the variations, but not over-reacting.
3.4.2 Weather-severity variation
3.4.2 Weather-severity variation Bruno Prior Tue, 15/12/2020 - 11:52- In the default datasets for 2016-18, we take the profiles affected by the weather (e.g. temperature, wind, insolation) as they were in those years. As already mentioned, these years were marginally above the average temperature, but not exceptional.
- The last exceptionally cold year in the UK was 2010, and even that was only exceptional to its surrounding decades, but not especially exceptional on a long-term comparison.
- Although many years have been above the long-term average recently, we have not had an exceptionally hot (in summer) / mild (in winter) year within the period for which granular data is easily accessible.
- The weather has many aspects that affect energy systems differently. Warmth in winter reduces energy demand (i.e. less heating required), but in summer it increases demand (more cooling). Wind, sunshine and rain can also affect demand, and their timing has a significant bearing on the availability of certain technologies. A windy year may be helpful (if the wind coincides with the periods of high demand) or unhelpful (if the wind coincides with the periods of low demand). We cannot test multiple factors simultaneously, so we focus on the effect of temperatures in these variations.
- The correlations are small (positive or negative) to non-existent. One cannot assume that a year whose weather is helpful or harmful in one regard will be helpful or harmful in others. They may cancel out, or they may amplify.
- For the purposes of testing sensitivities, we synthesise demand profiles based on the raw data for the three years 2016-2018 (e.g. peaks and troughs occur according to the timing in those years), but amplify the unhelpful extremes in the “severe” profile and dampen them in the “mild” profile. For example, the “severe” profile assumes it’s both a cold winter needing a lot of heat, and a hot summer needing a lot of cooling. The “mild” profile assumes the opposite. The amplification/damping is scaled to produce the levels of energy consumption seen in years with severe or mild winters and the temperatures seen in severe or mild summers.
- These are therefore artificial profiles and do not reflect conditions that actually happened. But, as they are a significant factor, it is important to test for the impact of weather extremes. And as actual granular data is not available, this was the least-bad solution that we were able to devise. It is hopefully a reasonable stress test, though not a set of conditions that have occurred nor are likely to occur in exactly this form.
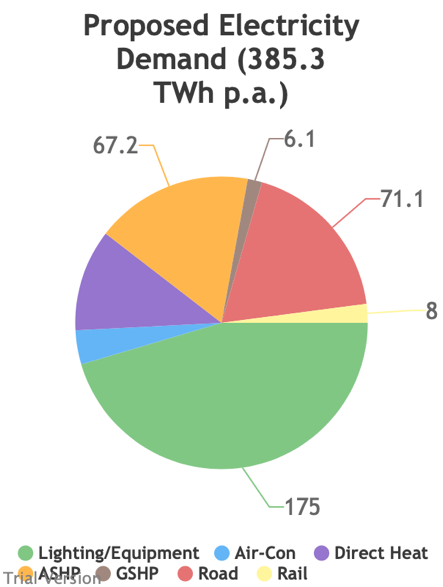
- Temperatures make a material, but in this scenario not massive (±4%), difference to the annual demand for electricity. Remember, this scenario assumes only one-third of heat has been electrified.
| Mild | Normal | Severe |
|---|---|---|
|
Image

|
Image
|
Image
|
- You need to look closely to spot the differences in the comparison of inflexible generation with wholesale demand. The difference is primarily in the red line (demand), which is higher to the right.
| Mild | Normal | Severe |
|---|---|---|
|
Image
|
Image
|
Image
|
|
Image
|
Image
|
Image
|
|
Image
|
Image
|
Image
|
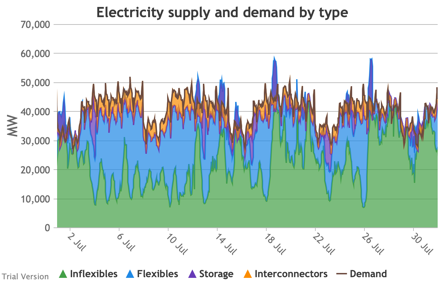
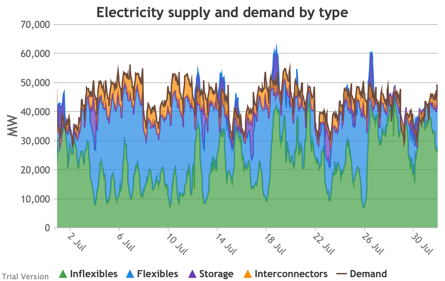
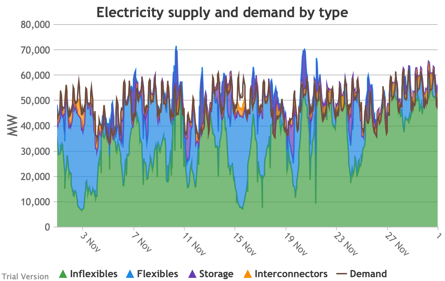
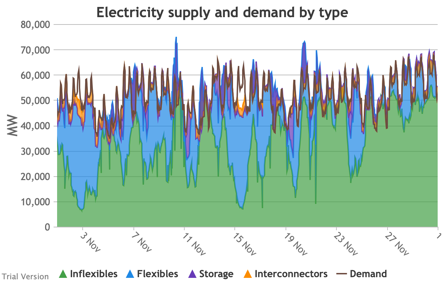
- The effect of the weather is more visible in the following charts of demand net of inflexibles. In the first row (Jan) for instance, the highest peaks are clearly higher on the right than the left, and the periods of negative demand (excess inflexible generation) are smaller on the right than the left.
- The system in this scenario needs to be able to cope with periods where we need 60 GW from storage, interconnectors and flexible generators, not just the 55 GW at which it maxes out in normal conditions. If the system is designed accordingly, then there will be more excess capacity in mild and normal years than would be the case if the system were designed to cope with no more than a typical year.
- Conversely, there is also a choice to be made between sufficient storage to absorb the excess even in mild years, or basing storage capacity on the needs of a normal year, in which case some excess output will be wasted in mild years, and not enough will be stored up for the extreme periods in severe years.
- The discrepancies are small in this scenario, but the diminishing marginal returns on these edge cases already illustrate the economic fallacy of aiming for Net Zero. They become severe as the system becomes exponentially more stressed as decarbonisation deepens.
| Mild | Normal | Severe |
|---|---|---|
|
Image
|
Image
|
Image
|
|
Image
|
Image
|
Image
|
|
Image
|
Image
|
Image
|
- The differences in the usage of the storage capacity are subtle. That is because this scenario deliberately chose a ratio of MW to MWh that implied high frequency, short-term storage, so the potential to store the bigger peaks or to keep supplying the longer shortfalls is very limited. Nevertheless, you can see small differences.
| Mild | Normal | Severe |
|---|---|---|
|
Image

|
Image
|
Image
|
|
Image
|
Image
|
Image

|
|
Image
|
Image
|
Image
|
|
Image
|
Image
|
Image

|
- Again, small differences are just about discernible in the charts of electricity supply by type. The deficit periods are clearly exacerbated in severe conditions.
| Mild | Normal | Severe |
|---|---|---|
|
Image
|
Image
|
Image
|
|
Image
|
Image
|
Image
|
|
Image
|
Image
|
Image
|
- Likewise for the charts of electricity supply by source (i.e. technology):
| Mild | Normal | Severe |
|---|---|---|
|
Image
|
Image
|
Image
|
|
Image
|
Image
|
Image
|
|
Image
|
Image
|
Image
|
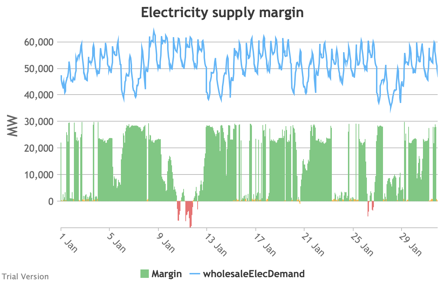
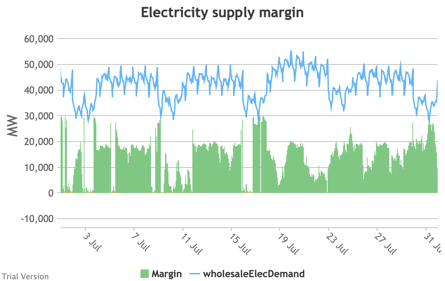
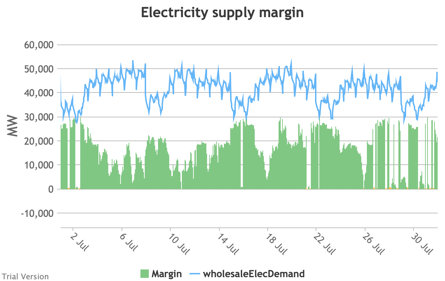
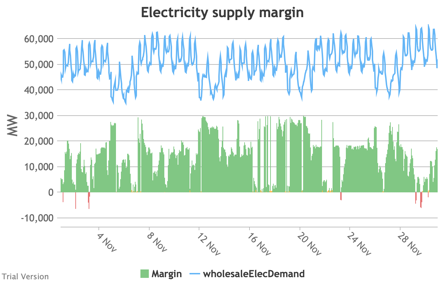
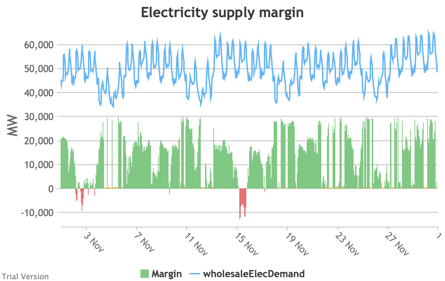
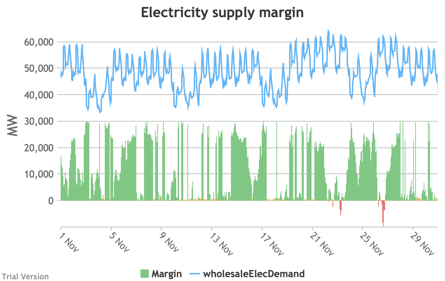
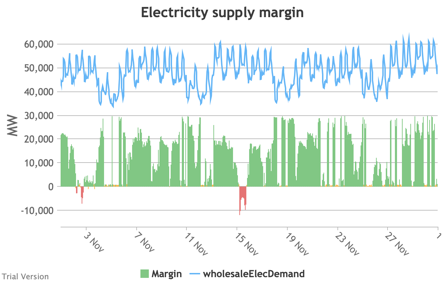
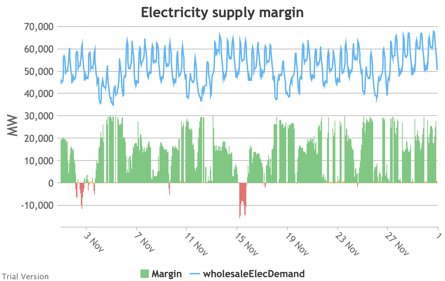
- That feeds through to the electricity supply margin.
| Mild | Normal | Severe |
|---|---|---|
|
Image
|
Image
|
Image
|
|
Image
|
Image
|
Image
|
|
Image
|
Image
|
Image
|
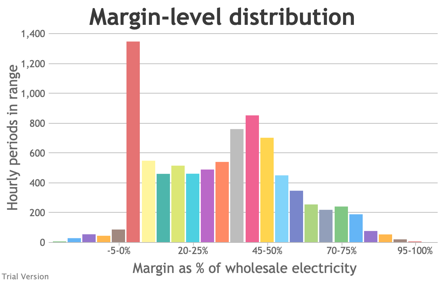
- The differences are also subtle but visible in the aggregate contributions of technologies and in the distribution of the electricity supply margin.
| Mild | Normal | Severe |
|---|---|---|
|
Image
|
Image
|
Image

|
|
Image

|
Image
|
Image
|
|
Image
|
Image
|
Image
|
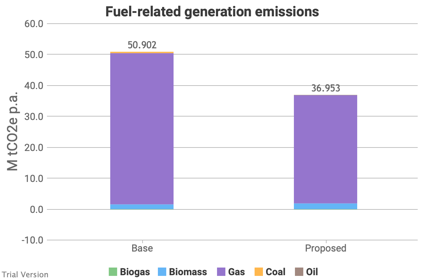
- Likewise, the differences in carbon impact are small. Of course, a cold winter and hot summer emit a little more carbon than a mild winter and summer, because we have not fully electrified and decarbonised in this scenario.
| Mild | Normal | Severe |
|---|---|---|
|
Image

|
Image
|
Image
|
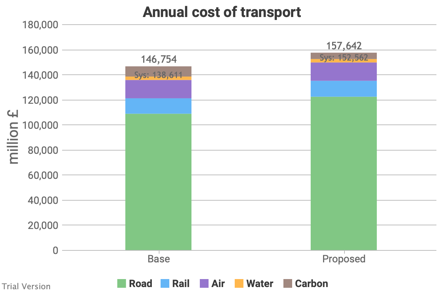
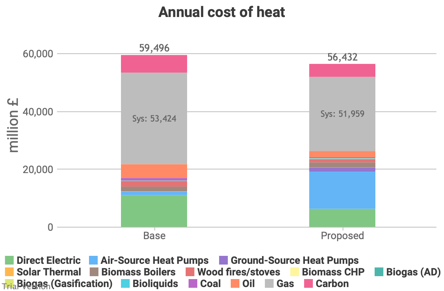
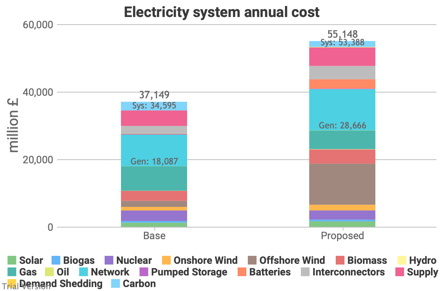
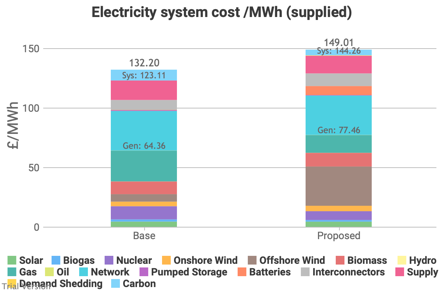
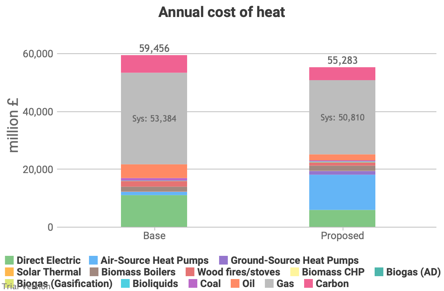
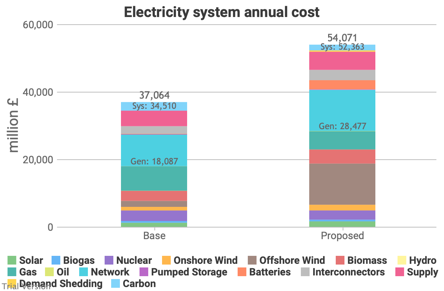
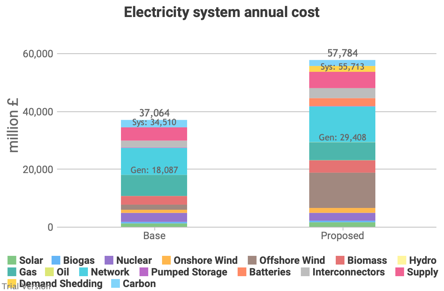
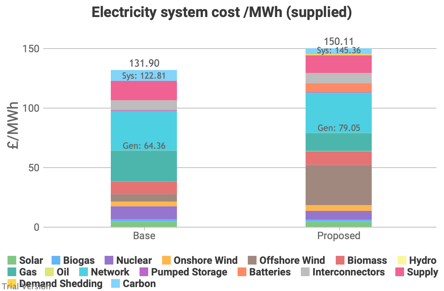
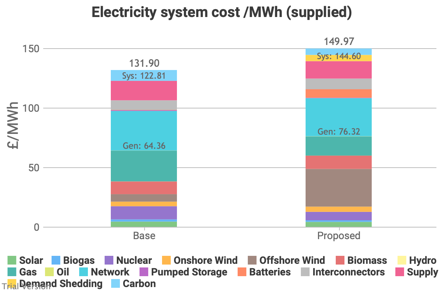
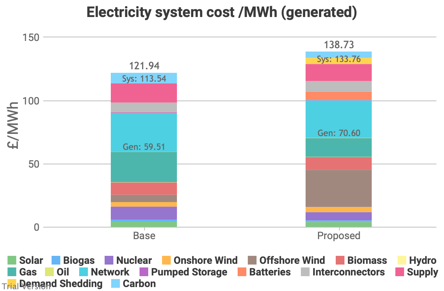
- The severity of the weather has a detectable impact on annual costs.
| Mild | Normal | Severe |
|---|---|---|
|
Image
|
Image
|
Image
|
|
Image

|
Image
|
Image
|
|
Image
|
Image
|
Image

|
|
Image
|
Image
|
Image
|
|
Image
|
Image
|
Image
|
|
Image

|
Image
|
Image
|
- Extreme weather (in both directions, severe or mild) increases the cost of energy. For severe weather, it increases the strains on the system and pushes at the supply margins. For mild weather, capacity is under-utilised, which increases the cost per unit, even though the total cost falls.
- Under no conditions is the increase in the overall cost justified by the reduction in the cost of carbon at £50/tCO2e. If these measures are justified, they imply a cost of carbon of around £150/tCO2e, in which case, what other measures would have been justified had we proceded by carbon-pricing rather than winner-picking?
- Significantly, the cost of demand-shedding increases from £378m in mild conditions, to £669m in normal conditions, to £2,011m in severe conditions. The system is fragile to unusual conditions, because margins are very tight. Tight margins give the impression of offering good value by avoiding under-utilised investment, but are a false economy if resilience is a significant consideration, as it should be for energy systems. The true cost of a resilient system at this level of decarbonisation would be higher. And it may involve more fossil-fired reserve (contrary to the intent of policy), as we will explore in the next sensitivities.