3.3.12 Costs
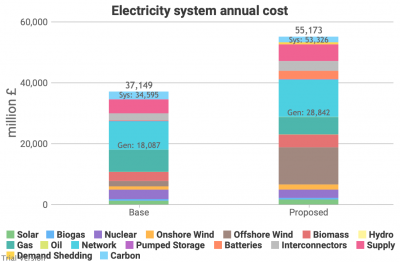
3.3.12 Costs Bruno Prior Thu, 17/12/2020 - 12:09- Moving on to cost, this is our estimate of the annual cost of our electricity systems, comparing the status quo with this scenario.
- The costs for each technology include estimates of variable (primarily fuel) and fixed (e.g. maintenance and overheads) annual costs, and the amortized capital cost at the Weighted Average Cost of Capital assumed for this scenario (the default: 7%; just below the level used recently by the regulator).
- It also differentiates between existing and new capacity, using figures based on historic data for the existing capacity, and (typically somewhat reduced) figures claimed by technology advocates for new capacity, reflecting assumed learning curves. As explained above, even where contracted values appear to confirm significant cost reductions, until they are implemented and prove sustainable at that price for a few years, this assumption is not safe. But it is the least contentious available.
- A key point to appreciate about this significant increase in the costs of the electricity system is that a larger proportion of our energy is supplied by electricity in this scenario, so the impact on the cost per MWh is smaller, as we will see below.
- The labels indicate the sum of (a) Generation costs (“Gen”) and of all System costs (“Sys”) including generation, transmission/distribution, storage, supply, and demand-shedding, but excluding the social cost of carbon (the blue band at the top). The label at the top is all costs including the cost of carbon at the rate specified for the scenario (the default of £50/tCO2e in this case).
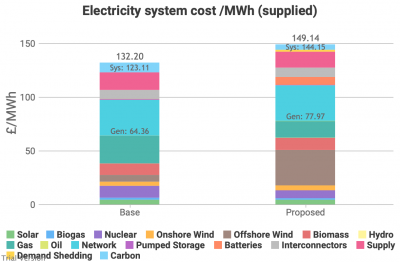
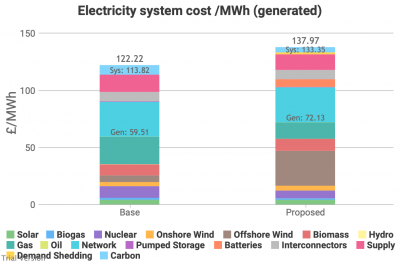
- These charts show the effect of this scenario on the cost per unit of electricity (a) supplied (i.e. net of losses), and (b) generated (i.e. before distribution losses). These are the costs in the previous chart divided by total electricity supplied or generated. They are not the cost per MWh of each technology. Stacking the latter would not indicate anything useful. This allows you to view the shares of overall costs that can be attributed to each component of the electricity system, allowing for the fact that the total amount of electricity supplied has increased under this scenario.
-
The obvious headline from these charts is that the cost has increased not only in absolute terms, but also per unit of electricity. The hope is that economies of scale and learning curves reduce the cost of electricity per unit in an electrified energy system. We incorporate such assumptions into our model. But they are outweighed by:
- a switch from (on average) cheaper technologies to more expensive technologies (before taking externalities into account, see below), adding around £13/MWh,
- higher costs of storage and interconnection to mitigate the effects of a higher proportion of intermittent generation in the mix, adding about £7/MWh, and
- some demand shedding to deal with the periods when demand simply can’t be met, adding about £2/MWh.
There are also costs that are not included in this model, such as the STATCOMs needed to run without spinning reserve of thermal generation for sustained periods.
- These higher costs are somewhat offset by a lower cost of carbon from decarbonising the electricity system. Despite higher volumes of electricity, the absolute cost of carbon (at £50/tCO2e) falls from £2.5bn to £1.8bn. Adjusting for the quantity of electricity, this is reflected in a larger fall (proportionately) from £9 to £5 per MWh supplied. You may note that these savings in the social cost of carbon are worth nowhere near as much as the cost of the measures to achieve them. That is not an entirely fair comparison, because part of the purpose and effect of electrification could be to shift more of the carbon burden on to electricity. This can only be compared accurately across all our energy systems. We do that below.
- You may notice that the estimated cost of electricity in the base scenario is lower than it was in practice. That is mainly because our model does not incorporate the costs of government measures, whether subsidies or taxes. It is intended to analyse the underlying economics before it is distorted by interventions, partly to be able to assess the cost/value of those measures. As non-environmental taxes (e.g. VAT) fall very lightly on electricity in the UK, the discrepancy is mostly about the cost of environmental subsidies and the levies to fund them.
- One of the main arguments for the winner-picking approach to decarbonisation adopted by successive governments over three decades was that a carbon tax was too expensive, as it fell on the whole economy. Targeted measures would allow a better bang for the buck. The fallacy in that argument is exposed in these charts. The discrepancy between the cost of electricity with and without government impositions under the status quo is much greater than the cost of the carbon emitted, valued at £50/tCO2e. Either carbon is worth several multiples more than that, or the effect of government measures (both directly as levies and indirectly through the system impacts that are not attributed to decarbonisation in government assessments) has been more expensive than if we had simply put a price on the carbon.
- That is inevitable when one thinks about the intention of the winner-picking approach. The objective is to target higher levels of support at the “winners” whilst avoiding paying similar levels of support to technologies that the government does not favour. If the government’s winners were cost-competitive, they would not need to pick winners – their favourites would prosper under a technology-neutral regime. The “banding” that has been rife in energy policy is precisely a mechanism to pay high levels of support to expensive technologies favoured by government. If you pay more for expensive technologies and try to minimise support to cheaper technologies, you should not be surprised that you get more of the expensive technologies and less of the cheaper technologies. In sum, that means costs are higher than a system where higher levels of support were not directed to expensive technologies. We are now reaping the consequences of the denial of this inevitability, as high costs collide with increasing deployment.
- We are asked to believe that falling costs mañana and even greater deployment will justify this in the long run. They will have to “go some”, because the high costs and large capacities of existing projects are locked in to long-term contracts under the support schemes. The claim will only be credible when retail prices net of the shadow price of carbon fall materially, rather than increase as they have done inexorably over the past decade when we were being promised that these learning curves were bringing down the costs.
- Notice the narrow, orange band second from top on the right, and the absence of an equivalent on the left. This is the cost of demand-shedding, due to inadequate supply to meet demand at times. It is estimated in this scenario at £1.8bn, or £2/MWh. That is relatively modest, because it is needed for “only” 232 hours in the year. But remember that:
- we were on the edge for another 1,335 hours,
- the model assumes that costs ratchet as the frequency and scale of demand-shedding increases,
- this scenario is under relatively benign weather conditions, and
- it assumes a system that has been only partially electrified and decarbonised.
As we will see below when we do some sensitivity analysis, this element has the potential to become as economically destructive as it was in the 3-day weeks in the 1970s.
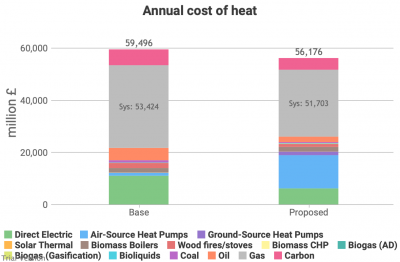
- Turning to other uses of energy, this is the effect of this scenario on the costs of heat.
- A modest cost-saving excluding externalities is increased when one takes into account the cost of carbon.
- This is the cost of the heat systems. The effects of electrification on the electricity system are calculated outside this component, but are internalised in the model through the price charged to electric heating.
- The modest cost-saving comes primarily from assuming some of the extra heat pumps will displace direct electric heating, which is particularly cost-ineffective. We cannot assume much more displacement than this (around half of the existing direct electric heating) because a significant proportion of direct electric heat is not for building heat, but rather for industrial purposes for which alternatives will often not be able to replicate effectively the characteristics that electric heat provides.
- The displacement of some gas-, oil- and coal-fired heating by heat pumps has a negligible effect. On the basis of this integrated cost (of fuel, other running costs and amortized capital costs), heat pumps work out slightly cheaper than oil and slightly more expensive than gas and coal. When we include the cost of the carbon externality at £50/tCO2e, gas and heat pumps are roughly level-pegging, while oil and coal fall behind.
- This model does not attempt to tie the deployment of heat pumps to the efficiency of the buildings in which they are installed. It includes building efficiency separately (see sections 3.2.15 to 3.2.20 above). In this scenario, we assume the government has roughly implemented its current plans, which consist mostly of efficiency improvements rather than rebuild. It is arguable (based on the government’s own data for the effect of retrofit insulation measures) that for most existing buildings, such measures will not be adequate to make them suitable for heat pumps, given the inadequacy of the fabric of most British buildings. In reality, there are a few likely outcomes from a widespread roll-out of heat pumps into existing buildings with retrofitted efficiency measures, when property owners find their heat pump struggling to maintain the temperature in imperfectly-insulated buildings in the coldest periods:
- They try to invest in further efficiency improvements. These are likely to be problematic (e.g. requiring the sacrifice of internal space, and offering a relatively low bang for the buck);
- They invest in secondary heat sources, if they are still permitted (e.g. solid-fuel or electric stoves, assuming there would no longer be a gas supply for a secondary gas heater). Widespread deployment of electric stoves to supplement heat pumps in periods of peak demand would be highly problematic for the electricity system;
- They replace the heat pump with an alterative technology; or
- They get used to wearing extra layers of clothing in the house when it’s cold outside.
In Sweden, (b) was the most common solution. The Swedish wood-pellet industry saw its sales decline for a couple of years after the government began a big push to promote heat pumps. Sales then picked back up again, as people installed pellet stoves to back up their heat pumps, once they realised the heat pumps could not do it alone. Sweden obviously has colder temperatures than the UK (roughly double the number of heating degree-days), but it also has significantly more efficient buildings (thanks to much higher domestic-energy prices), which mean that its domestic energy consumption per property is only slightly higher than the UK despite the much colder weather.
- Most of the other technologies are not significant. Many of the reasons for these assumptions are given in section 2. Biomass is currently the most significant of the other technologies. We assume a modest increase in biomass boilers, but a larger decrease in wood fires and stoves, in accordance with government air-quality plans.
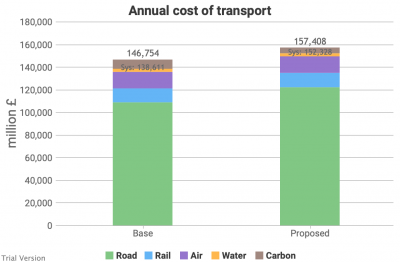
- Transport costs increase under this scenario.
- We have assumed no material change to air and water transport, so the differences relate primarily to road transport, with smaller changes to rail (because rail is a smaller component of transport).
- Transport costs excluding externalities increase by nearly £14bn p.a. The carbon avoided through electrification saves £3bn in social costs, so the net effect is an increase (including externalities) of £11bn. Again, this can only be considered in the round, across all energy, because the system changes may displace cost and carbon from one sector to another. But prima facie, this is poor value.
- Road transport costs (excluding externalities) increase by over £13bn. Current road transport costs are distorted by the levels of tax and duty, which exceed the cost of the road network and externalities. This model ignores government interventions, so this increase is comparing the cost of current road transport excluding taxes and duties with a scenario where 50% has been electrified (also excluding taxes and duties). Obviously, the road network has to be paid for, and externalities have to be accounted for under both systems. But including current taxes does not help that comparison. As is currently under discussion in policy circles, something will have to substitute for fuel duties to pay for the roads, if electrification radically reduces revenues from fuel duties. The model assumes that the cost of the roads is mostly fixed (i.e. depending on the extent of the network, not invariable regardless of construction or abandonment), with a modest variable component for usage (e.g. lower maintenance for lower throughput). This scenario assumes no significant change to the road network and usage, but the electrification of 50% of that usage.
- Rail costs increase from £12.3bn to £12.7bn p.a. under the assumption that another 30% of energy consumption is electrified. Again, this measures energy costs without taxation, but the effect is less significant because rail uses red diesel, and the cost of the network and externalities is not being overcharged through taxes and duties. In fact, the effect of excluding government interventions is the other way round for rail, as the most significant intervention is the government grant. Our model attempts to estimate raw costs, ignoring such grants, in both the base and the proposed scenario. The modest change in this scenario assumes no significant change to the network, and a modest increase in operating costs because the cost of electricity (exc. tax) under this electrification scenario is greater than the cost of diesel (exc. tax) even allowing for the greater efficiency of electric motors. Including externalities, there would be little difference in cost, i.e. rail electrification is roughly worth the social benefit, according to the assumptions in this model.
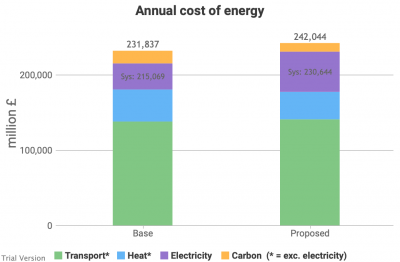
- The combined impact is to increase total energy system costs by over £15bn p.a. Carbon costs reduce by £5bn (at £50/tCO2e), so the net effect is an increase in costs of £10bn, i.e. not justified at <£150/tCO2e.
