3.3.10 Electricity generation capacity utilisation (load factors)
3.3.10 Electricity generation capacity utilisation (load factors) Bruno Prior Thu, 17/12/2020 - 11:15
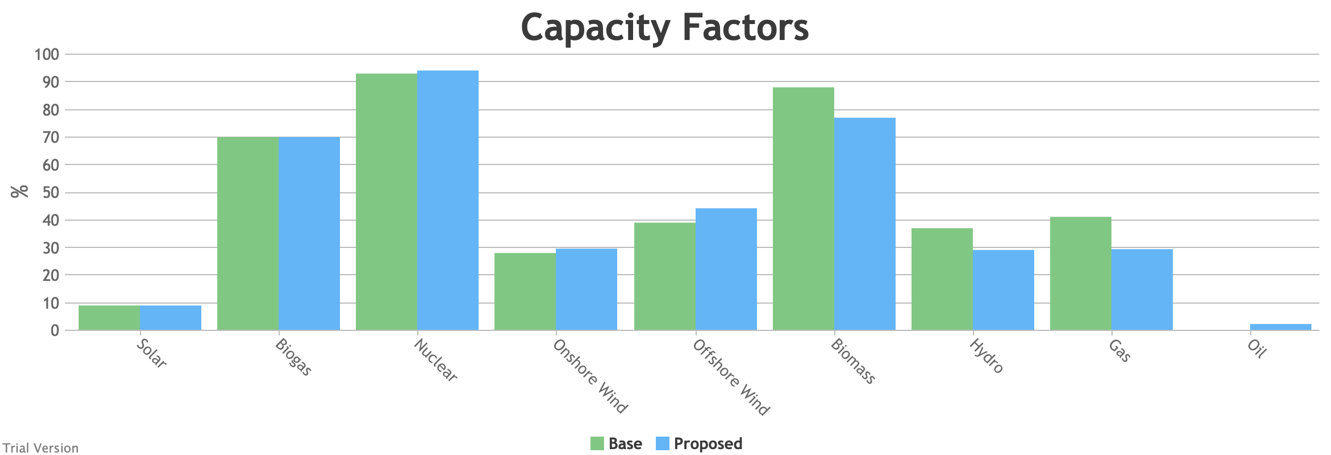
- Inflexibles like nuclear, solar and wind get priority and therefore are only curtailed for the periods (rare in this partially-electrified, partially-decarbonised scenario) when inflexible output exceeds demand. The increase in the load factors compared to the 2017 status quo, despite modestly more curtailment in this scenario, is because we assume higher load factors for the new wind and nuclear projects than for the existing units (in accordance with industry claims for wind, and reasonable expectations for new vs old plant for nuclear).[1]
- We assume hydro (because of low marginal operating costs) and biomass (because of its carbon value) are called before gas, and they therefore take less of a hit to their load factors from periods when they are not needed.
- We assume gas takes priority over oil (and coal, but this scenario includes no coal) because of its low cost and lower carbon footprint. The scenario only includes a small amount of oil (small-scale standby generation), so the bulk of the swing supply is covered by gas, which therefore experiences a significant hit to its load factor. Oil would show an even worse impact on its load factor, if there had been any transmission-connected oil to provide seed data in the base years.
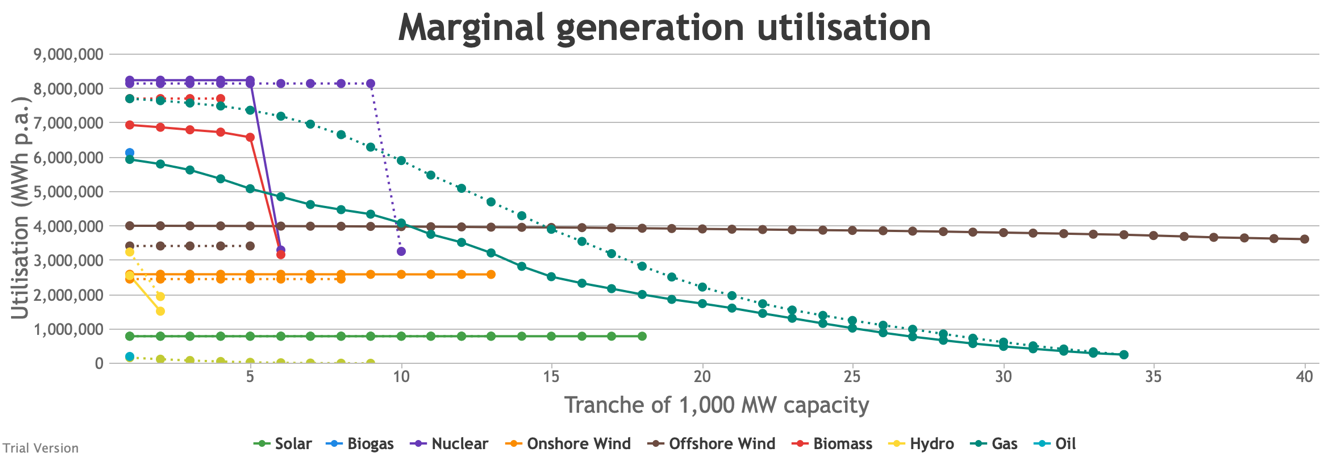
- We can visualise the impact on each technology’s load factor depending on the installed capacity through a marginal analysis. In the following chart, we split each technology’s installed capacity in this scenario into GW chunks. The first points (left to right) indicate how much we would expect the first GW of that technology to generate over the year. The second points indicate how much we would expect from an extra GW, and so on. The solid lines indicate the performance under this scenario. The dotted lines indicate the technology’s performance under the status quo.
- Don’t worry about the steep drops for the last GW of some technologies. This is simply a mathematical artefact, allocating the last GWh to the last GW. The reality would be more graduated, but it does flag the technologies with falling marginal utilisation levels.
- The obvious victim of this scenario is the utilisation of gas generation. The fact that it nevers hits zero (and that we have multiple periods with negative margin) shows that we still need all this capacity. But the increase in wind and solar dramatically hits the utilisation levels of gas generators, which will be reflected in the cost of gas generation per MWh. This is not (as is often portrayed by wind evangelists and reported in the media) gas becoming more expensive, neither absolutely nor relatively vs wind. It is the higher penetration of wind increasing the cost per MWh of the standby generation. It is absurd that this is often presented as a benefit of the intermittent technologies, and often discounted from the calculation of their cost to the system. It will be increasingly expensive to maintain a sufficient capacity margin as increasing intermittent capacity reduces the utilisation levels of the flexible technologies.
- You can see a similar effect to a lesser extent for hydro and biomass, and it would be worse for oil (let alone coal) if there were any significant capacity. What this is telling us is that, whilst you can always add capacity to balance intermittency if you are willing to pay for it, the marginal cost of that will head ever upwards. Because there will always be periods when neither the wind is blowing nor the sun is shining, and because those periods are not frequent/regular enough to justify storage capacity, additional intermittent capacity does not displace any of the marginal flexible capacity.
- What this means is that, on a true marginal-cost analysis of decarbonisation, unless carbon is hugely expensive (which would have ramifications across the model and for policy), the level of decarbonisation at which the marginal cost of additional decarbonisation exceeds the marginal value of that decarbonisation is almost certainly above Net Zero. Net Zero is economically incoherent as a policy.
[1] Nuclear’s capacity factor in the base scenario looks too high, but reflects Elexon data. It probably indicates that Elexon’s figures for nuclear capacity reflect reasonable operational expectations, not the theoretical maximum potential as constructed.

